

Stocking densities
Disease levels, growth rates, feed efficiency and mortality are closely correlated to stocking densities but the threshold level will vary with age and weight of pig, its health status, the cubic capacity of the building and from farm to farm.
For example a farm that is free of EP, PRRS and APP would accommodate a much higher stocking density than an infected farm because the latter would be prone to pneumonia, due to the presence of the infectious agents.
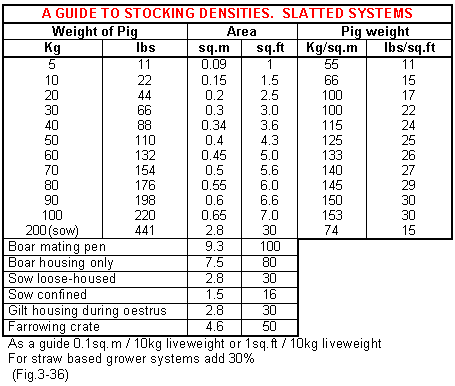
A guide to stocking density that would be considered acceptable from a welfare view point is shown in Fig.3-36.
Factors to consider in assessing stocking densities
- Type of flooring and drainage.
- Age of pig and type of housing.
- Quality of insulation in the floor.
- Quality of insulation of the building.
- Type of feeding system.
- Availability of feed.
- Temperature requirements of the pig.
- Can the pigs produce sufficient heat?
- Are the pigs huddled?
- Air flow and draughts.
- Welfare requirements.
- Are mortality levels higher than the target?
- Is there disease?
- Is tail biting or vice a problem?
- Measure the daily liveweight gain and weight for age.
- Is there variation in growth within the pen?
- Levels of respiratory or enteric disease.
What are the best stocking densities for maximum efficiency of output?
The guidelines in Fig.3-36 could be used but in order to measure true economic output in the most efficient terms it is necessary to measure lbs or kg of liveweight sold per unit of space per 12 months.
To determine this the following information is needed:
- The total occupied floor area of the unit.
- The opening and closing period liveweights.
- The weight the pigs entering the pens.
- The weight of pigs sold.
The weight sold per unit of space is then calculated as follows:
(wt sold + closing period wt ) - (wt entered + opening period wt)
Total pen space (square ft. or metres)

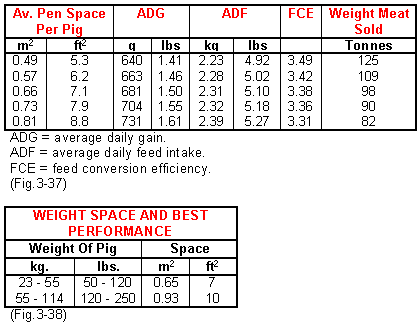
Powel and Brunn in Canada showed responses at varying mean stocking densities Fig.3-37. It can be seen that whilst daily gain, feed intake and feed conversion were better at the lower level stocking density level of 0.81 sq.m.the economic benefits in terms of meat sold were better at 0.49 sq.m.. Fig.3-38 shows predicted space for the best ADG and FCE.


