

The case for price bottoms being in place in US hog markets
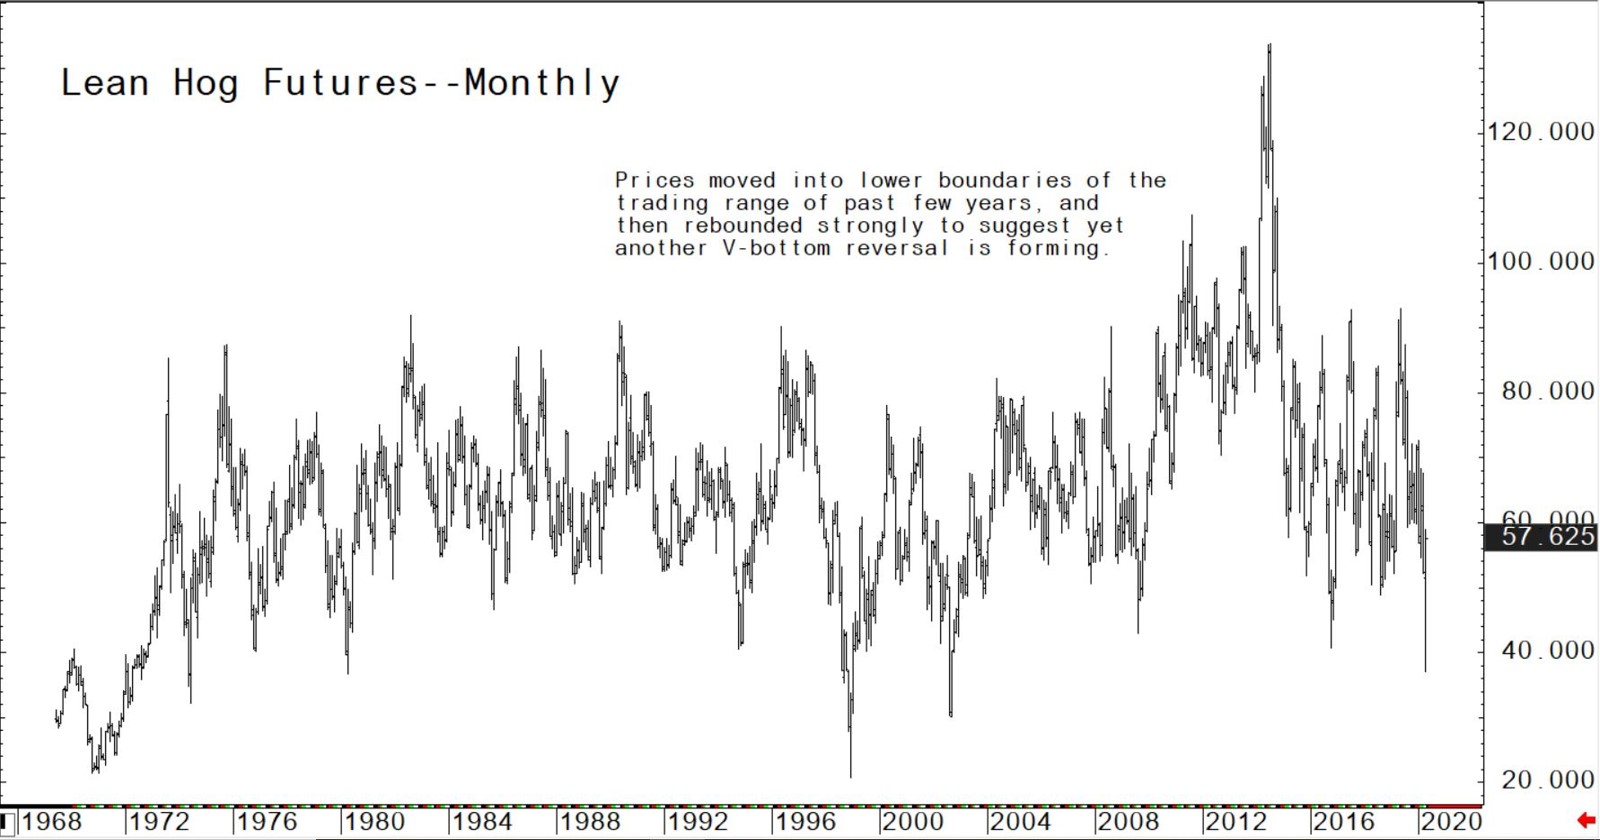
It’s been a very rough period for the global swine industry. Rough waters still lie ahead. However, there are now early, but solid, technical clues that the hog futures market has put in a major price bottom.An examination of longer-term price charts (see below) shows that big “V-bottom” reversals, such as is seen on the monthly lean hog futures chart at present, have marked major price lows over the past many years. On the shorter-term daily bar chart for June lean hog futures, prices have been trending higher for the past two weeks and this week hit a four-week high. These technical signals argue strongly for at least sideways and more likely sideways-to-higher price action in the lean hog futures market in the days and weeks ahead.
But before pig market participants get too bulled up, consider the following: US hog slaughter numbers continue to drop, with Wednesday’s slaughter estimated at 271,000 head, a 200,000-head (42 percent) retreat from year-ago levels. The US government has invoked the Defense Production Act to keep meat-packing plants open, but there are still a lot of questions about how much impact that will have and how quickly any increase in meat in processing will occur. Tensions are escalating at US food plants between essential workers who feel pressure to stay on the job and their employers, who are striving to maintain the US food-supply chain without interruption. A Wall Street Journal report said the conflicts “speak to a vexing problem for government officials and food-industry leaders: how to produce enough food for people across the country while keeping safe those working to produce it.”
The next week’s likely high-low price trading ranges
June lean hog futures: $52.00 to $60.77, and with an upside bias.
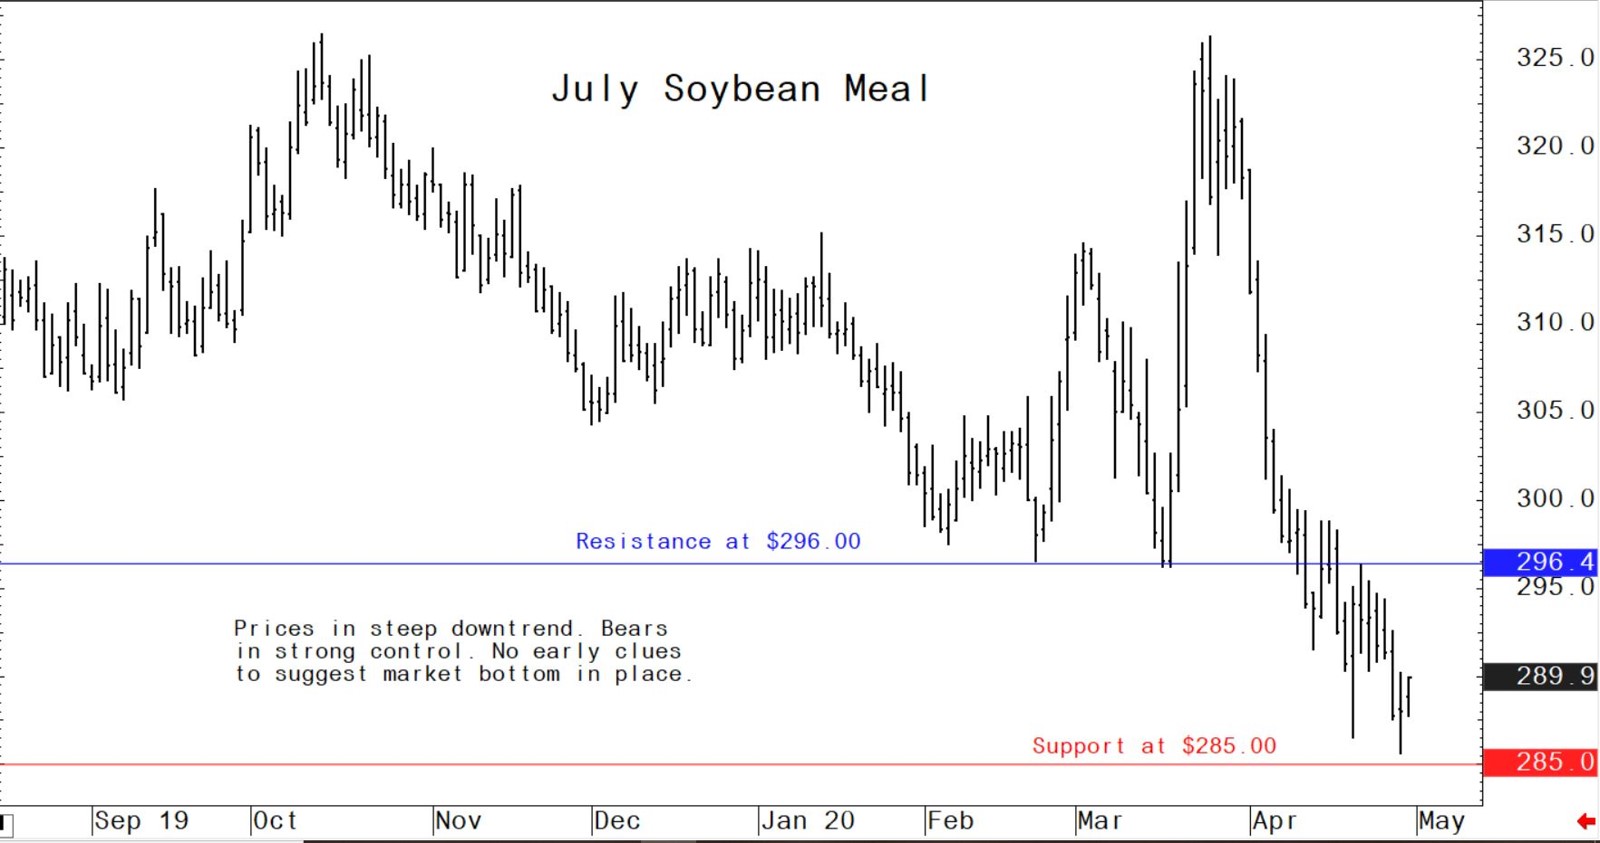
July soybean meal futures: $280.00 to $296.00, and with a downside bias.
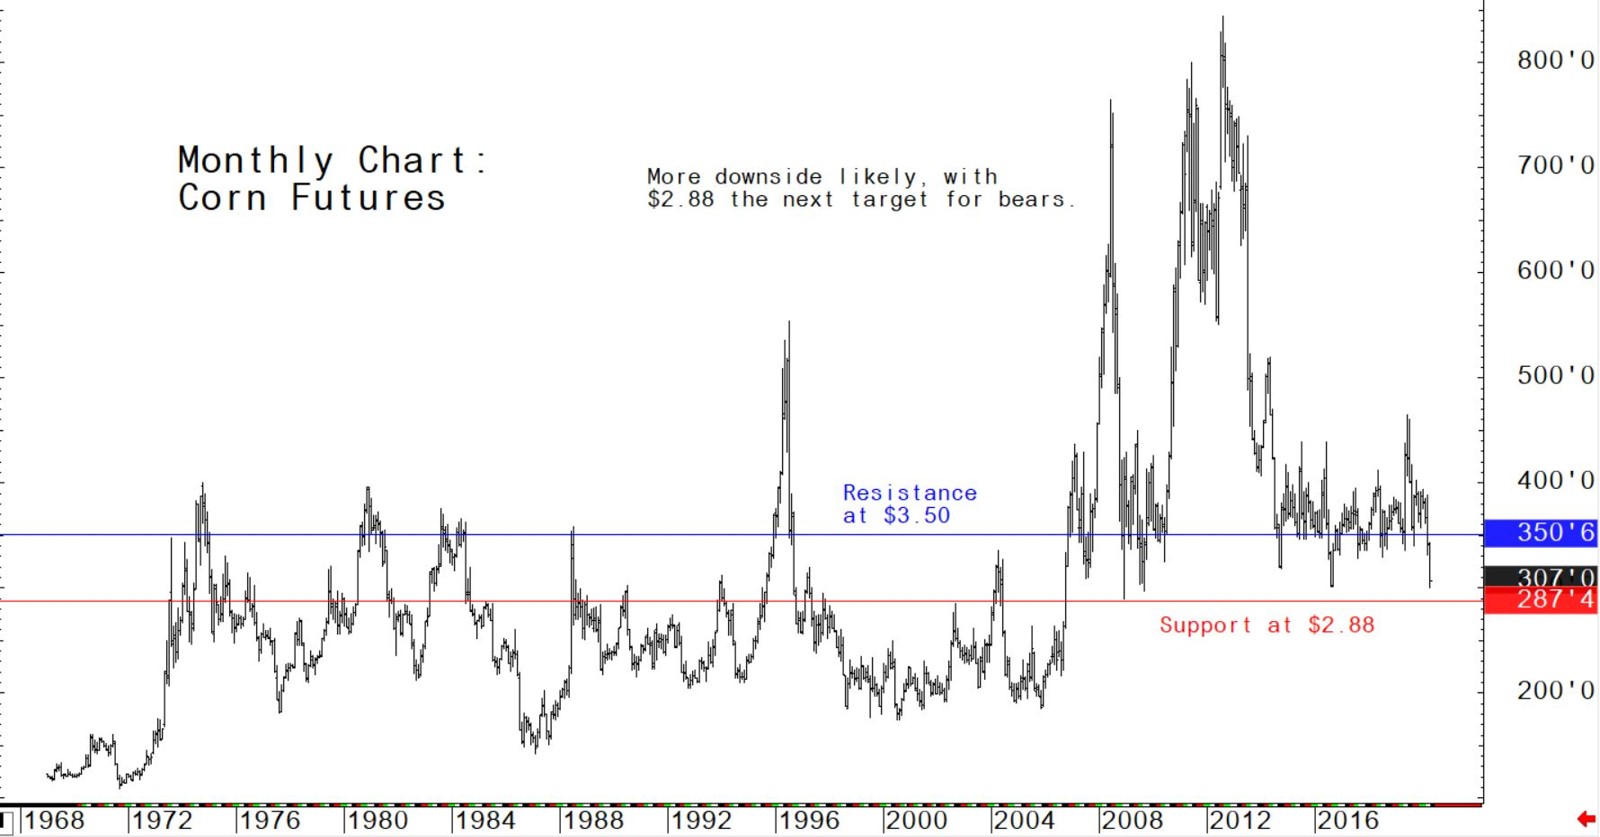
July corn futures: $3.01 to $3.25, and a downside bias.
US pork export sales gain as beef sales decline in latest week
US pork net export sales of 50,300 metric tons (MT) were reported for 2020 - up 27 percent from the previous week and 12 percent from the prior four-week average. Increases were primarily for China (35,100 MT), Mexico (7,200 MT), Japan (3,100 MT), the Philippines (900 MT), and South Korea (800 MT). Exports of 44,700 MT were up 9 percent from the previous week and 15 percent from the prior four-week average. The destinations were primarily to China (20,700 MT), Mexico (9,600 MT), Japan (5,000 MT), South Korea (3,300 MT), and Canada (1,600 MT).
US soybean cake and meal net sales of 163,600 MT for 2019/2020 were up 59 percent from the previous week and 13 percent from the prior four-week average. Increases primarily for Colombia (87,700 MT), Canada (44,000 MT), Honduras (9,600 MT), Jamaica (9,000 MT), and the Philippines (7,800 MT), were offset by reductions primarily for New Zealand (25,000 MT) and the Dominican Republic (3,200 MT). For 2020/2021, net sales of 60,100 MT were for unknown destinations (60,000 MT) and Canada (100 MT). Exports of 204,400 MT were down 39 percent from the previous week and 28 percent from the prior four-week average. The destinations were primarily to the Philippines (70,400 MT), Canada (21,300 MT), Mexico (20,100 MT), Honduras (19,000 MT), and Colombia (13,800 MT).

© Jim Wyckoff

© Jim Wyckoff

© Jim Wyckoff


