

CME: Hog Slaughter During W10 of 2017 3.4% Higher Than a Year Ago
US - Below are items that we found interesting as we looked through the numbers, report the Steiner Consulting Group, DLR Division, Inc.Hog slaughter last week was estimated at 2.313 million head, 3.4 per cent higher than a year ago. While we have known all along that hog supplies would increase relative to a year ago, so far the pace of the increase continues to track under what was indicated in the December Hogs and Pigs report.
In the last four reported weeks hog slaughter as averaged 2.3 million head, 3.2 per cent higher than last year but less than the +4 per cent indicated by the December survey. Hog slaughter should remain near 2.3 million head for the next two weeks. If correct, this would imply hog slaughter growth of over 5 per cent and this should bring the year/year comparisons more in line with the survey results.

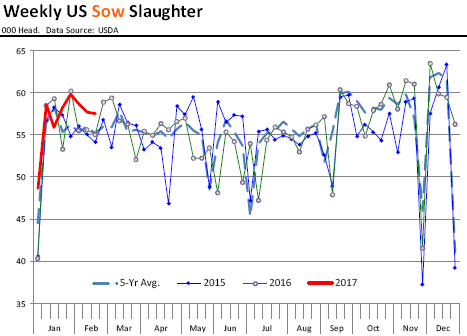
Producers are bringing a few more sows to market than a year ago but we would not conclude this is a sign of hog producers starting to reduce the production base. Rather, the increase in the number of sows going to slaughter simply reflects the effect of a larger breeding inventory. More breeding stock, more cull animals available.
Sow slaughter for the week ending 25 February (two week lag in reporting) was 57,478 head, 2.4 per cent less than a year ago. In the last four weeks sow slaughter has averaged 58,392 head/wk, 4 per cent higher than a year ago. The hog breeding herd as of 1 December was almost 6.1 million head, 1.5 per cent higher than a year ago and 2.5 per cent higher than in December 2014. The ratio of sow slaughter during the quarter to the breeding inventory at the start of the quarter still does not indicate to us that hog producers are looking to contract.
For the three months of December, January and February we estimate sow and board slaughter at around 809,000 head, calculating a 13.3 per cent ratio to the 6.1 million head inventory on 1 December. This ratio compares with the average 13.9 per cent for all the quarters since 2010. During periods of liquidation, the ratio tends to climb over 15 per cent.


