CME: Supply/Demand Estimates for US Pork
US - It is easy to get lost sometimes amid all the various reports that are issued each day. There is daily and weekly slaughter numbers, carcass weights, cold storage reports, inventory reports, export data, etc. One of the ways in which analysts try to manage all this flow of information is to construct a balance table that accounts for three components: how much is coming in (this could be from domestic production or from import sources, how much is going out (this is product that is consumed domestically or sent to export) and finally what’s the change in inventory position, write Steve Meyer and Len Steiner. 16 June 2016
 4 minute read
 By:
By: USDA presents the results of this exercise and their forecasts each month in their WASDE report. Their data is presented on an annual basis, similar as to what they do for other commodities.
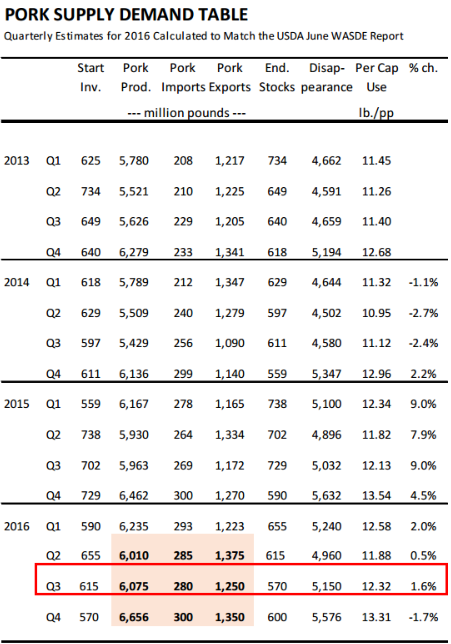
However, in order to examine supply/demand conditions during specific times of the year one needs to break down the information on a quarterly basis. The table below shows this calculation for pork.
Because USDA only gave us annual estimates for 2016, we calculated how their estimates would look on a quarterly basis.
In the grain complex, analysts look at the stocks/use ratio and its relationship to historical prices in order to forecast prices forward. In the meat complex, analysts look at per capita consumption/use to do the same thing. So a big part of this exercise is to calculate that per capita number. It brings together shifts in output, trade flows and stock adjustments and also accounts for the tendency of human beings to have more mouths to feed today than they did the year before. Changes in consumer demand (incomes, dietary changes, food safety, etc) also will influence the ultimate price.
But as you see new data come in about inventories, slaughter, weights and exports, we urge you to come back to the balance table and evaluate the potential impact.
So what did the latest USDA projections tell us about the pork market and how does that jive with recent moves in the futures market. After all, June hog futures went off the board at $81.675/cwt, under the contract high that was established in March.
July and August futures, however, established contract highs yesterday as market participants clearly anticipate a much tighter balance sheet that what USDA presented in its latest report.
We have highlighted the Q3 numbers in the attached table for that reason. Per capita use/availability for the quarter is calculated at around 12.32 pounds per person (this is retail wt. basis), 1.6 per cent higher than it was in 2015, 10.7 per cent higher than in 2014 and 8 per cent higher than in 2013.
If USDA is correct, does this not mean that implied prices should be lower than last year? Not exactly. It is always good to look at that y/y change.
Last year per capita availability/use jumped 9 per cent compared to the previous year. Markets need time to adjust to that kid of supply increase, hence the sharp pullback in pork prices in 2015. The implied increases this year are more modest, in part because of a more robust export market.
In addition, end users, be this retailers or foodservice operators, have had time to adjust and thus are better able to absorb the supply increase. But part of the reason for the continued gains in the summer hog futures is speculation that export volumes will continue to gain as China/Hong Kong expand their purchases of US pork.
The latest USDA forecast suggests to us that they expect pork exports the second half of 2016 to be up around 7.4 per cent. Is this too low and could China sales completely upend these estimates?
In 2011, explosive China exports added 131 million to Q3 exports and then another 236 million to Q4. Testing for ractopamine limits export potential (relative to 2011) but there is today more ractopamine free pork than even a year ago. At this point futures are pricing in the risk of a potentially explosive export demand and, to a lesser extent, the potential for lower supplies than the March report indicated.