CME: US Hog Slaughter Tracked Above Year Ago Numbers
US - USDA-AMS weekly reported hog slaughter has tracked above year ago numbers every non-holiday shortened week so far this year. Not surprising given the dramatically improved PEDv situation this past winter, write Steve Meyer and Len Steiner. 15 October 2015
 3 minute read
 By:
By: Through the end of September, both hog slaughter and pork production were tracking about 8 per cent above 2014. Since beginning of April, barrow and gilt dressed weights have moderated from year ago, settling about 2 to 5 pounds below 2014 to contrast the increase in availability of animals.
Additionally sow slaughter has been above year ago numbers since middle of April, indicating at least some modest pull back in future pork production growth.
On the price side, all sectors have experienced significantly lower prices this year compared to a supply tightened 2014. Again, not surprising given the difference in PEDv effect on the industry the winter of 2013/14 compared to 2014/15.
Prices for both feeder pigs and slaughter hogs are hovering around their respective 5 year average values.
On the meat side, pork belly prices have been surprisingly strong since the beginning of July and seem to have supported the cutout value. Pork byproduct value continues to be weak, as we have seen softening in international demand.
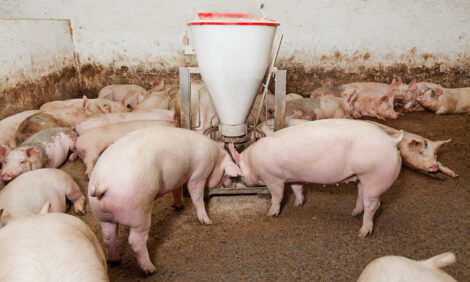
As a reminder, the number of total animals in the U.S. (up 3.7 per cent yearover-year) and the number of market hogs (3.9 per cent above a year ago) were both record large in the USDA-NASS September Hogs and Pigs Report.
The U.S. market hog count was 62.41 million head. Importantly, the breakdown data indicated that the increase in market animals is front-end-loaded. As of September 1st, the heavyweight categories were up (e.g. the number of animals in the 120-179 pounds range were up 8 per cent); in contrast, the number of light weight pigs (under 50 pounds) was down 0.5 per cent year-on-year. The breeding herd count at 5.986 million head was 1 per cent above 2014’s, a rather modest increase.
Still, the U.S. breeding herd was the largest for September 1st since 2008.
The largest year-over-year slaughter increase in 2015 was expected for the third quarter, projected to be up just over 11 per cent while the fourth quarter is expected to be 6 per cent to 7 per cent above 2014’s.
Going into the fourth quarter, we seasonally see a ramp up in hog slaughter, but we do not expect there to be an issue with capacity limitations. Looking ahead to 2016, some quarters could have slight declines in hog slaughter compared to 2015. However, U.S. pork production may be about unchanged to slightly higher in calendar year 2016 relative to 2015’s.
One of the more impressive aspects about this year, is even with a significant increase year-over-year in production and a corresponding decrease in prices, estimated farrow to finish returns have stayed relatively strong. These numbers are calculated by Iowa State University and can be found here.
In 2014, the industry experienced record returns with a tightened supply and ramp up in prices. Although prices are back down to more “normal” levels, estimate returns have only been in the red 2 months so far this year (February and March), through September. The most recent data estimates farrow to finish total profit in September was $12.29 per market hog.
The Livestock Marketing Information Center projects that slaughter hog prices in 2015 will be about 30 per cent below 2014’s and at the lowest annual average since 2009. Currently, forecasts for 2016 suggest only the first quarter of that year may have lower hog prices than occurred in 2015. For the year, prices could actually increase slightly. There are two major unknowns for 2016: 1) on the supply side, the question is how much of an impact PED virus will have this winter on piglet survival; and 2) on the demand side the major question is to what extent U.S. pork export tonnage will rebound.
Looking into 2017, pork production is expected to increase around 2 per cent year-over-year, with prices softening slightly (annually down about 4 per cent) compared to 2016 due to the increased supply.