February US Pork Exports Better, Still Lag 2014
US - February was another tough month for pork exports. That really isn’t news to anyone, but the truth is that exports were indeed better relative to January but still trail 2014 levels substantially, writes Steve Meyer for the National Hog Farmer. 7 April 2015
 3 minute read
 By:
By: Total US pork exports in February totaled 377.3 million pounds carcass weight equivalent. That figure was 8.5 per cent higher than in January. If one allows for one less business day in February, the month-to-month increase would be nearly 14 per cent but we don’t usually apply that practice to exports. I figured we were all in need of some better news, and I haven’t been delivering much of that lately.
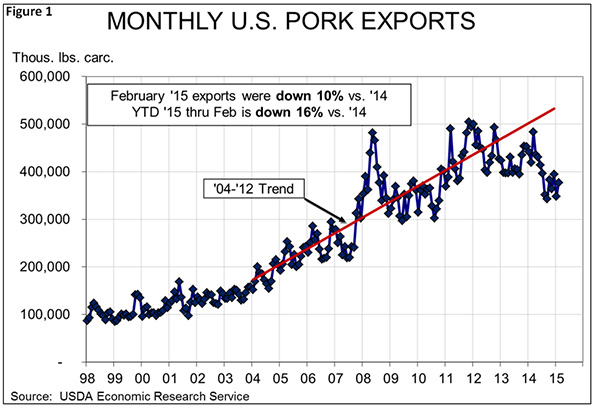
The year-on-year change for February was -10.1 per cent , a significant improvement over January’s -21.4 per cent versus 2014. February’s shipments bring the year-to-date total to 725.011 million pounds carcass weight equivalent, 15.9 per cent less than one year ago.
February exports were still impacted dramatically by the West Coast port labor slowdown which was not tentatively settled until Feb. 20. Little progress was likely made in alleviating the backlog of export containers by the end of February. We doubt that we will see significant improvement in the March data given predictions that it will take until at least May to get things back to normal.
One warning we have heard from packer export executives is that the large “lump” of product that was on our ports at the slowdown’s end will now be moved to the shores of our customers and will not be completely gone for several months beyond May. That applies primarily – and almost solely – to frozen product, of course, but the message is that exports may not get back to “normal” until late summer.
What is more concerning is that the conditions for export will not likely be anything near the “normal” we have known since at least 2006 and, arguably, 2003. The reason, of course, is the roughly 20 per cent run-up in the value of the dollar since last summer.
Figure 2 shows the weekly chart for Intercontinental Exchange Group’s Dollar Index futures contract. It is composed primarily of the Euro, Canadian dollar and Yen, but that percentage is pretty representative of the dollar’s increase versus other currencies as well. The Canadian dollar and Yen are just over 17 per cent more valuable than on July 1 while the Euro has lost 24 per cent versus U.S. dollar over that time. Importantly, the U.S. dollar has gained 43 per cent versus Brazil’s Real since July and just over 100 per cent (i.e. cut the Real’s value in dollars in half) since mid-2011.
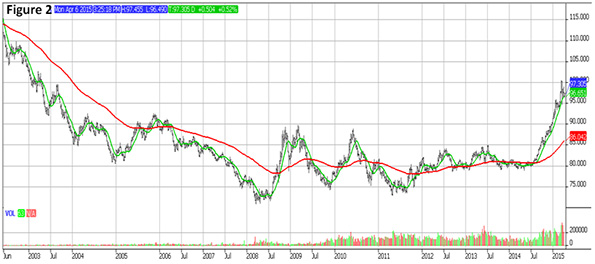
The good news is that the Korean Won has lost only nine per cent of its value since July and the Chinese Reminbi is still virtually the same since Chinese authorities peg its value to the dollar. But even this “good” news is empty since our competitors’ currencies have lost value to the US dollar and thus also to these more stable currencies. The relative stability of the Chinese and Korean currencies mean that US products have not changed value by much in those markets but the changes of other currencies still mean competitors’ products are cheaper. We can’t win for winning.
Of our major customers, shipments to Canada (+1.3 per cent ), Mexico (+11.6 per cent ), Korea (+80.7 per cent ) and the Caribbean (+16.2 per cent ) were higher than last year. Shipments to China/Hong Kong were more than 80 per cent smaller than in February 2014 while those to Japan and other markets fell by 16 per cent and 26 per cent , respectively. See Figure 3.
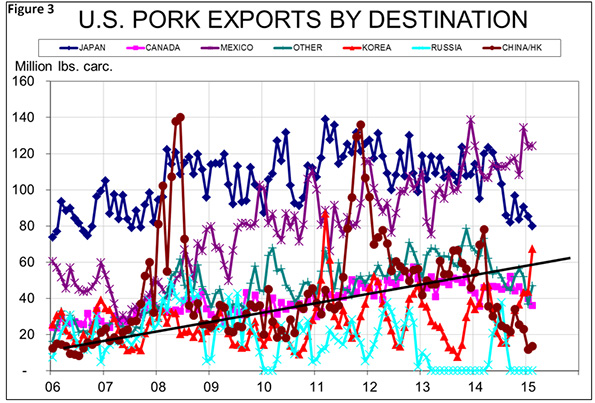
Year-to-date exports are higher only to Mexico (+5.3 per cent ), Korea (+56 per cent ), the Caribbean (+16 per cent ) and Taiwan (+13.7 per cent ). The Korean increase, and even more so the Taiwan increase, comes on a very small base in 2013.