

USDA Report Contributes Softening Expectations for Growth
US - On 27 September, USDA released the Quarterly "Hogs and Pigs" Report as of 1 September 2013. Given the host of issues coming into the report, USDA’s survey results will be dissected and debated for weeks if not months to come, writes Lee Schulz.Overall, the take-home contribution of this report was softening expectations for growth, at least in the short-term, and larger than expected hog supplies. Several final estimates were outside the range of prereport expectations with a few major surprises regarding year over year changes. Growth in the breeding herd of 0.4 per cent was 1.1 per cent lower than the average of the pre-report estimates softening expectations for growth even with lower feed costs expected in the next 12 months. The inventory of market hogs weighing less than 50 pounds was up 0.9 per cent, weighing 50 to 119 pounds was up 1.1%, and weighing 120 to 179 pounds was up 1.5 per cent. Pre-report expectations were for these categories of market hogs to be down on average 1.2 per cent, 1.1 per cent, and 1.5 per cent respectively. Market participants were watching these categories closely for an indication of the impact from Porcine Epidemic Diarrhea Virus, or PEDv, with many analysts expecting significant year over year declines in these market hog weight categories. However, according to the USDA data, PEDv has had only a very minimal impact on overall supplies.
A Rundown of the Estimates
Table 1 provides a summary of the 1 September 2013 estimates for the United States. The U.S. total hogs and pigs inventory, at 68.360 million head, was 0.3 per cent more than a year ago. The breeding herd inventory, at 5.814 million head, was up 0.4 per cent and the total market hog inventory was up 0.3 per cent at 62.46 million head. The inventory of feeder pigs less than 50 pounds, at 20.085 million head, was up 0.9 per cent and the inventory of feeder pigs 50 to 119 pounds, at 18.087 million head, was up 1.1 per cent. Market hog inventory weighing 120 to 179 pounds, at 13.284 million head, was up 1.5 per cent while inventory weighing 180 pounds and over, at 11.090 million head, was down 4.5 per cent. The large year over year decline of 3.5 per cent in market hog inventory weighing 180 pounds and over may stand out at first glance, but using 2012 as a benchmark is misleading as this was a time when producers were aggressively marketing hogs as they were trying to reduce feed usage.

June-August sows farrowing, at 2.925 million head, was down 0.1 per cent and near the mid-point of June- August sows farrowing for the history of the data. The June-August pig crop, at 30.210 million head, was up 1.9 per cent. This was the largest June-June pig crop in history dating back to 1973. The industry continues to realize tremendous progress in efficiency as producers have been able to increase pig crops while decreasing the breeding herd as a per cent of the total hogs and pigs inventory. In fact, the June-August pigs per litter set a new all-time record high at 10.33, a 2.0 per cent increase from the previous year.
The outlook for hog supplies in 2014 will be affected by producer intentions to farrow more sows in the coming months. Intentions are for September-November sows farrowing, at 2.900 million head, to be up 0.4 per cent and December-February sows farrowing, at 2.870 million head, to be up 0.9 per cent; netting about two-thirds of one per cent increase in these five months. Projecting farrowing intentions out with projected commensurate pigs per litter it looks like the potential is there for a new record high for the September-November pig crop at 29.877 million head. This would be an increase of 364,000 head from the record set in 2007. A December- February pig crop projection of 29.115 million head would also be a record high, an increase of 96,000 from the record set in 2012-13. The point is pig crops remain and project to be very large compared to historical levels, record highs in possibly.
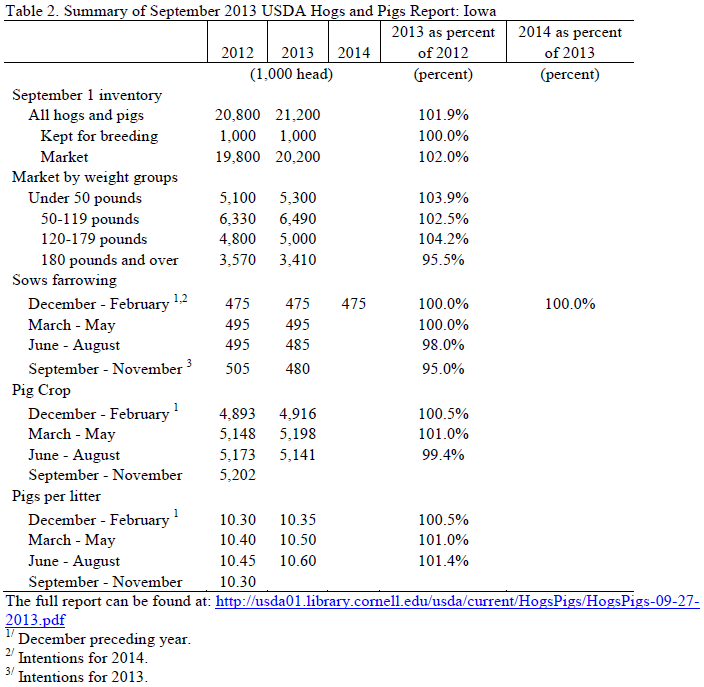
Table 2 provides a summary of the 1 September 2013 estimates for Iowa. Iowa producers increased inventory of market hogs 2.0 per cent while the breeding hog inventory was unchanged. Total hog and pig inventory at 21.200 million head, was up almost 2.0 per cent from a year ago. Market hog inventories in Iowa provide further confirmation of the state’s growth in finishing capacity. The inventory of feeder pigs less than 50 pounds, at 5.300 million head, was up 3.9 per cent and the inventory of feeder pigs 50 to 119 pounds, at 6.490 million head, was up 2.5 per cent. Market hog inventory weighing 120 to 179 pounds, at 5.000 million head, was up 4.2 per cent while inventory weighing 180 pounds and over, at 3.410 million head, was down 4.5 per cent. Producers in Iowa appear to be moderating their farrowing plans. Sows farrowed in June-August were 2.0 per cent below year previous levels and farrowing intentions call for 5.0 per cent decrease year over year in September-November. Sows farrowing in December-February are expected to be unchanged from 2012-13.

Commercial Hog Slaughter Projections and Lean Hog Price Forecasts
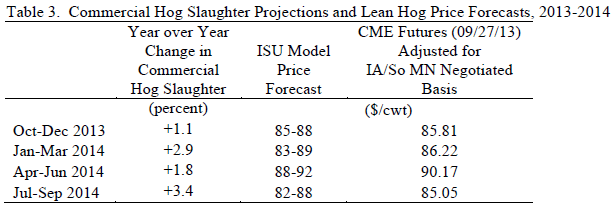
Table 3 contains the Iowa State University price forecasts for the next four quarters and the quarterly average futures prices based on 27 September 2013 settlement prices. The futures price forecasts are adjusted for an historic Iowa/Southern Minnesota basis. The table also contains the projected year over year changes in commercial hog slaughter, which is expected to see year over year increases.

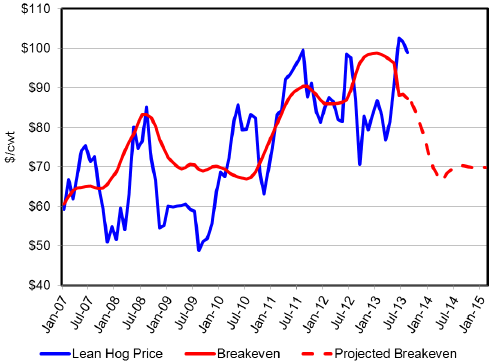
The price outlook for hogs is good in comparison to the cost of production. Farrow to finish margins remain positive — and have been so to a degree for the last four months according the Iowa State University Estimated Returns. Figure 1 shows the computed breakeven levels with profitable conditions expected to remain given price forecasts. The projected breakeven cost for October is $83.85/carcass cwt. The figures for November and December are $80.49 and $77.15, respectively.
Figure 1. Lean Hog Price vs Breakeven – Farrow to Finish, Iowa, Monthly

Note: Derived using the Iowa State University Estimated Returns model. Estimates are developed to serve as a barometer of prices and costs and are not intended to represent any one operation.
Further ReadingYou can view the USDA Hogs & Pigs report by clicking here. |


