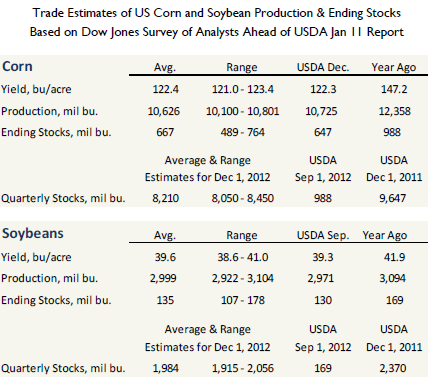
CME: Corn Stocks Expected to be Tight
US - It is now confirmed, 2012 was the hottest year since records began in 1895, with average temperatures across the US Midwest jumping by some 4 degrees above normal, write Steve Meyer and Len Steiner. 10 January 2013
 2 minute read
And much of the Western
Corn Belt continues to struggle with a moisture shortfall, requiring 6-9
inches to bring the Palmer drought index to a reading of –0.5, a tall
order and a reason to worry going into spring plantings. In this context,
trade will pay close attention to a couple of important USDA reports
coming out on Friday (11 January). USDA will finalize its US corn production estimate for 2012 and on average analysts expect USDA to lower
the final production figure by about 100 million bushels compared to
the December estimate. Trade continues to think that harvested area
was smaller than USDA previously indicated, with more damaged corn
going into silage.
Corn futures have been drifting lower for much of November
and December on reports of extremely slow export sales and lower
ethanol output. Corn export sales have tracked as much as 50 per cent below
year ago levels and they are on a trend to be below 1 billion bushels for
the 2012-13 marketing year. The last USDA es??mates pegged total corn
exports at 1.150 billion bushels and judging from the analyst estimates,
the expectation is for USDA to lower the export figure by some 100
million bushels or so. Ethanol production also has declined dramatically
since 1 September. Average daily ethanol output for the September-November period
(which feeds into the quarterly demand estimates) was down about
9.4 per cent from last year, in line with the USDA ethanol use estimate for the
marketing year. Ethanol production dropped further in December
(hence the downward move in corn futures) as crude oil prices and
gasoline demand have languished. Daily ethanol production in December
was down 14 per cent from last year, so there is an outside chance USDA
will lower ethanol use but it is not highly likely. In the last round of
estimates, USDA pegged corn imports at 100 million bushels. It is likely
that number was too aggressive and USDA may pare it back some given
the shrinking gap between US and S. American corn prices.
While export, import and ethanol use numbers are somewhat
known, trade with get the first look at implied feed use during the first
quarter of the marketing year (September-November). For good reason this is called
feed and residual since it is calculated by subtracting from the 1 December stocks (to be released on Friday, 11 January) the supply that went into ethanol,
industrial use and export markets. On average, analysts have
pegged 1 December stocks at 8.210 billion bushels. This implies that
feed use during September-November was probably around 1.7 billion bushels.
Using the final USDA estimate for feed use, this kind of quarterly feed
use is modestly above historical ratios. This is the one area where we
could get a market moving surprise. It remains to be seen what kind of
an impact the early harvest in some areas had on the final stocks.
Heavy livestock and poultry weights (higher feed use per animal), lower
DDG feed availability and high prices for other feeds also may have
impacted the supply of corn that went into livestock and poultry. On
average, analysts expect corn stocks to be a tight 667 mil bushels, the
question is what kind of use adjustments, especially on the feed side,
will be needed to get to that number.
Ratio of Sep - Nov Qtr Feed Use to Total Feed Use
Sep—Nov 2012 Estimate As Implied by Dow Jones Analyst Survey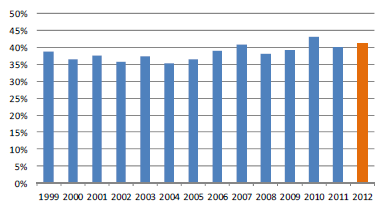
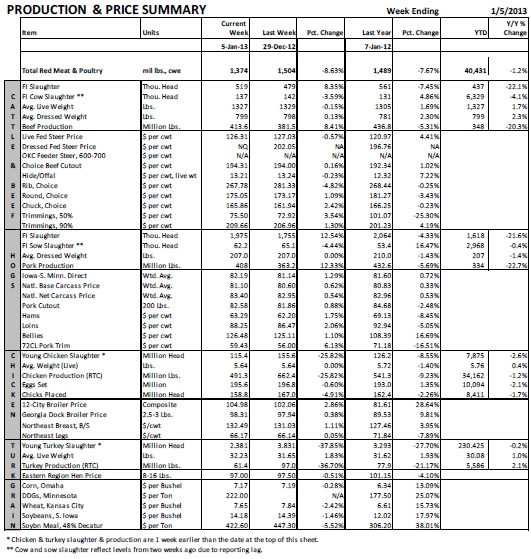
Note: Added 72CL pork trim to weekly price table, see below.