

Market Preview: Heavier Market Weights
US - In this week's "Market Preview" from National Hog Farmer magazine, Steve Meyer writes about hog market weights.It appears we dodged the bullet on a USDA Market News shutdown on Monday. It would not have taken long to realize just how dependent we are on these government data sources. The situation would have become very sticky for anyone who might have carried April Lean Hogs futures positions into Thursday’s close, since the Chicago Mercantile Exchange (CME) uses weighted average national net prices to compute the CME Lean Hogs Index.
Whether you like the reports or not, we have the best information system in the world. We would certainly miss them if they were gone – at least in the short run.
Persistently Heavier Weights
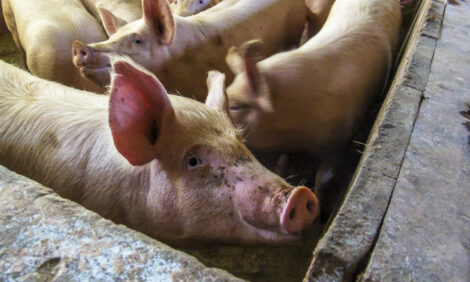
A frequently asked question at producer meetings this winter was: “Why are market hog weights so persistently high?“ As Figure 1 shows, average carcass weights for top barrows and gilts (the ones slaughtered by packers that are required to report under mandatory price reporting) have stayed near 208 lb. for most of this year. Last week’s drop was the first of any significance since January.

The run-up in weights last fall is well documented – better corn, cool fall weather, weekly slaughter runs near capacity all equal bigger hogs, especially when compared to the results we saw when 2009 corn was being fed.
My stock economist’s answer to the carcass weight question is: “Because it pays!“ While a completely acceptable explanation to the “practitioners of the dismal science of economics“ (although we generally are not dismal people!), laymen usually find the response to be flippant and lacking. So here is the long version:
First, economics tells us that the firm will increase output to the point where “marginal cost“ equals “marginal revenue.“ Marginal cost is the increase in total costs incurred by adding one more unit of output. Marginal revenue is the increase in total revenue from that one more unit of output. In the case of hogs, marginal revenue is the price per pound.
If marginal cost is less than marginal return, the firm’s profits increase as units are added – the added revenue exceeds the added costs. If production gets less and less efficient as output grows (recall the theory of diminishing marginal productivity/marginal returns), marginal costs grow with each unit of added output, which closes the gap until the firm incurs as much additional cost as it gains in revenue on an additional unit of output. The next additional unit would incur a loss, so the firm has found its profit-maximizing output.
The optimal hog weight decision is pretty much that – at what point does marginal return equal marginal cost? The interesting thing is that about the only cost that changes is feed cost. Unless you are talking about the very last group of pigs in the barn, the barn still must be heated, pigs have to be checked, etc. Water and death loss risk would add a bit to marginal costs, but not a lot.
Even with today’s very high feed costs, the hog market is encouraging more weight on pigs. My calculations would put a 16 per cent crude protein diet at about $300-$350/ton – or 15 to 17.5 cents/lb. The feed conversion ratio of today’s very efficient pigs is very likely 3.5 to 4.0, on a live weight basis. This means that marginal costs are 52.5 to 70 cents/lb., live. Friday’s national average net purchase price was $90.16/cwt., carcass, or $75.12/cwt., live. Clearly, it pays to put on the last pound of gain.
Ample Finishing Space
Another reason for the persistently high weights is that higher average weights are being driven, I think, as much by the bottom end of the weight distribution as the top end. Last year’s US barrow and gilt slaughter was 5.5 million head lower than in 2008. Those “missing pigs“ had been fed somewhere, implying 2.5 million or so empty finishing spaces. Some of that capacity has obviously exited the industry, but even two million more pig spaces would provide substantial slack for producers to leave some slower-doing pigs on feed and, thus, bring up the lower end of the weight distribution and, consequently, the average weight.
Figure 2 provides some data that support this “bring up the bottom“ idea. It shows the difference between the weights of barrows and gilts reported through mandatory price reporting (MPR) and all barrows and gilts under federal inspection. From 2002 through 2006, the difference grew as MPR weights increased at a faster rate than all barrow and gilt weights, implying more, and perhaps lighter, off hogs. That trend changed abruptly in 2007 – a time that corresponds to the first entry and, later, widespread adoption of circovirus vaccines. The differences have varied more-or-less seasonally since 2007, but the observation for the week of 26 March (1.8 lb.) is the lowest since the difference hit 1.6 lb. on 19 April 2008 (very likely the height of the impact of circovirus vaccines).

I do not expect average weights to come down very quickly. In fact, unless feed prices increase significantly (15 to 20 per cent), the only thing that will likely cause weights to decline is hot weather and even that will not push weights below last year’s levels this summer. I expect the first year-on-year declines to come in September or October. Even they may not happen if feed prices fall enough to leave marginal revenue higher than marginal costs. Hog numbers have not grown enough to crowd our finishing facilities to any degree and producers will very likely continue to add weight to those slower-growing pigs.


