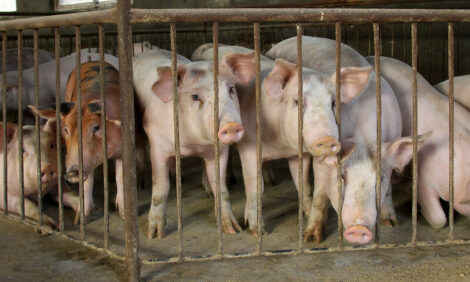


Ethanol Co-Products: A Livestock Dish Of The Day
US - About half of the cattle and swine operations in a 12-state region fed ethanol co-products or considered feeding them to their livestock last year, report the National Agricultural Statistics Service (NASS).Highlights
In the production process of converting corn to ethanol, important co-products are produced as well. These co-products, also called distillers grains or corn gluten feed, are created within the dry or wet mill process and can be fed to livestock. With the expansion of the ethanol industry, there is a greater supply of co-products. The goals of this study were to identify how many livestock operations were feeding co-products, which co-products were being fed, and the characteristics of those co-products. Information was also collected about how the operations have used and would like to use co-products and related services. In addition the study identified concerns and barriers which prevented operations from feeding co-products.
This study was a joint effort between the National Agricultural Statistics Service and the Nebraska Corn Development, Utilization & Marketing Board (an agency of the State of Nebraska). Approximately 9,400 livestock operations in Illinois, Indiana, Iowa, Kansas, Michigan, Minnesota, Missouri, Nebraska, North Dakota, Ohio, South Dakota, and Wisconsin were contacted by mail in February 2007 with a second mailing two weeks later and telephone follow-up in March.
This probability based survey included dairy cattle, cattle on feed, beef cattle (cow/calf), and hogs. Each species was stratified and sampled independently to represent all livestock operations in the 12 state region. For sampling efficiency, minimum operation size thresholds were set: 20 head for dairy cattle, 50 head for cattle on feed, 10 head for beef cattle, and 25 head for hogs. Hog data were summarized based on the sample operation's state headquarters and may include data from outside the 12 official survey states. The survey reference date was calendar year 2006. Of the 9,400 operations contacted 1,276 indicated they had used co-products during 2006. Their responses were adjusted for non-response and are reported in this release. Responses for operations not feeding co-products were also adjusted for non-response and are included only in the first and last tables of this release.
To view the full report, including tables, please click here


