


What's Driving the Grain Markets and What to Look out for Going Forward?
David Norris of Noggers Blog explained his view of recent feed ingredient price movements and where they might be heading next at the Pig Farmers' Conference organised by Teagasc in the Republic of Ireland in October 2012.The grain markets have always been volatile, but perhaps never more so than in
recent years. There have always been a varied set of factors behind fluctuations
in price movements in the markets, old favourites being: supply & demand,
weather, currency fluctuations etc.
In recent years, however, we have seen another force begin to have an increasingly
dominant role in determining price movements in the grain and other commodity
markets:
Money Flows
Make no mistake, this is currently the single biggest mover and shaker in the
grain sector at the moment. Regardless of what you might read elsewhere that
speculation is not a major influence on price movements in commodities as 'for
every buyer there must also be a seller', the author says that is
nonsense. In 1999, the Commodities Futures Trading Commission (CFTC)
deregulated the US futures markets, enabling funds to hold as large a position in
the grain markets as they liked.
It took a few years for hedge fund managers to realise the significance, and
earnings potential, of this apparently innocuous move. In 2003, Index Funds had
around $13 billion invested in commodities futures, by 2008 that amount had
risen around 2000 per cent to approximately $300 billion. Volumes traded in the grains
sector of the Chicago Board of Trade soared by around 500 per cent during this time, and after a lull in 2009/10 have increased further since (see chart below).
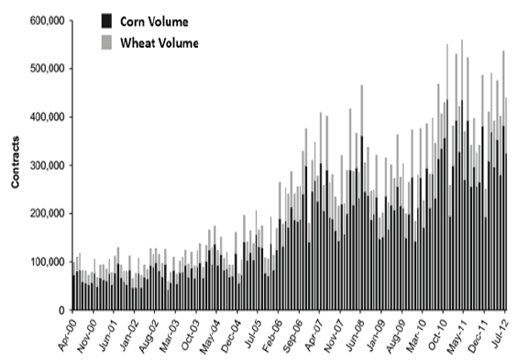
(Source: CBOT)
Yet world production of corn only increased by 32 per cent between 2003 and 2008, and
wheat output by eight per cent during the same period. Global consumption was also on the
up but by nowhere near as much: 23 per cent on the case of corn and only two per cent for
wheat.
So the volumes trading in Chicago grains were suddenly displaying an
extraordinary rate of expansion that bore little correlation to world production or
consumption levels in those commodities. With that increase in volume came a
dramatic increase in prices, this chart overlays the price of front month Chicago
corn on top of the previous volume chart:
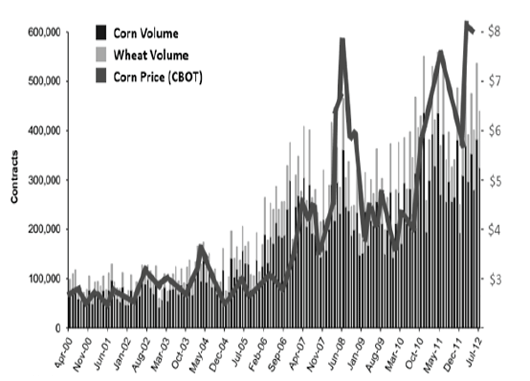
The Commodity Food Price Index shot up 125 per cent between the start of 2003 and June 2008, as world food prices went through the roof and people in underdeveloped nations were dying of starvation.

(Source: IndexMundi)
Then suddenly, after US wheat and corn prices had raced to then all-time highs,
we had the sub-prime induced crash. World commodity prices took a nose-dive,
including those of wheat and corn, even though the fundamentals of supply and
demand for those were essentially the same after the crash as before it.
After a brief period of subdued speculator activity in the commodities markets in
2009/10, volume suddenly increased sharply again in the second half of 2010
following the Russian drought, which gave the funds a renewed appetite for
grains. Corn and wheat both posted around an 80 per cent increase in price between
June and the end of December 2010, whilst soybean prices were up by nearly
50 per cent.
The correlation between corn prices and world food prices is obvious. Looking at
these charts, it also seems abundantly clear that the volume traded on Chicago
corn and wheat contracts is indeed also clearly linked to prices, even though
many so-called experts, and of course the exchanges involved themselves, try to
make a convincing case to the contrary.
So, we can see that volume has increased significantly over the last ten years,
but what kind of numbers are we talking here?
Exchange data from the US is frequently given in terms of bushels and/or so
many contracts or lots, one contract being 5,000 bushels in the case of grains,
which often makes the magnitude of the business being transacted difficult for
Europeans to quantify.
With that in mind, the author converted data from the official Chicago Board of Trade
web site into numbers that we can all understand:
| Chicago Board of Trade 2011 Futures Traded Volumes: | |||
|---|---|---|---|
| Commodity | 2011 Volume | Tonnes Equivalent | per cent of World Crop |
| Corn | 79 million | 10 billion | 1140 per cent |
| Soybeans | 45 million | 6 billion | 2500 per cent |
| Wheat | 24 million | 3.3 billion | 475 per cent |
So, in round figures, almost the entire volume of all the corn produced in the
world last year traded every single month in 2011; for soybeans, it was more than
twice the global annual output and for wheat we had a more modest but still
extreme, almost half the world crop trading every month last year.
This is clearly far more than bona-fide normal commercial hedging activity. Note
also that these are just futures trades, these figures do not include options trades
which also saw substantial volumes change hands.
Incidentally, the latest figures from CBOT, to the end of August 2012, show that
corn futures volumes have declined marginally so far this year, down 2.6 per cent year-on-year in comparison with 2011. Soybean volumes have jumped sharply, up
almost 25 per cent year-on-year with wheat volume also significantly higher, up 11.4 per cent.
Soybean prices have subsequently risen to an all-time high of almost $18/bushel
in early September this year, with corn prices also setting a record of nearly
$8.50/bushel in late August, whilst wheat set a four-year high close to $9.50/bushel
earlier in the summer.
The US has, of course, been gripped by drought this year; the question is are these
record prices justified? How much of these rises to unprecedented levels and the
current volatility in the markets are actually due to fund activity?
The following chart plots fund length in Chicago corn over the last twelve months,
overlaid by the front month price of corn to the end of August:
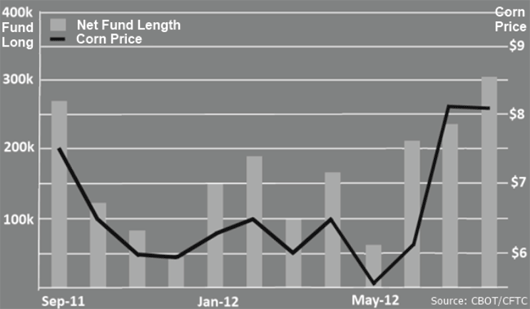
It would seem that either the funds are very good at guessing which way the
price of corn is going to go, or that the extent of their involvement in the market
dictates it.
The author contends that the argument that for every buyer, there must also be a
seller, and vice versa, and therefore fund activity cannot be responsible for
overall price movement is one that is inherently flawed.
The following interesting and enlightening article is well worth Googling, and
provided me with a lot of inspiration for writing this particular presentation:
'Imaginary wheat dominates the price of real wheat, as speculators
(traditionally one-fifth of the market) now outnumber bona-fide hedgers
four-to-one'. – Frederick Kaufmann, 'How Goldman Sachs Created the
Food Crisis'.
The uathor said that every market report quotes whether
funds were net sellers, or net buyers, of corn or soybeans on a particular day and
that almost invariably when they were buyers the market went up (and when
they were net sellers prices went down).
It could not really be that simple though surely, could it? The author decided to do a bit more
digging. The following chart plots the daily activity of fund money in CBOT corn,
as reported by Reuters, matched against where the most active Dec 12 corn
contract finished on that particular day between 1 August and 24 September 2012.
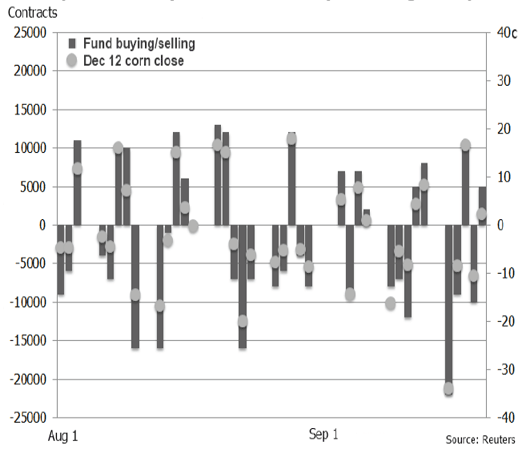
Not only did the market finish lower on every single session when funds were net
sellers, and higher when they were buyers during this period, the magnitude of the daily price movement seemed to match pretty closely whether they were big buyers/sellers on any given day or if their activity was more muted.
Incidentally, there was one session during the period when funds were said to be
net even on corn on the day – 17 August. On that particular day, corn prices hardly
moved at all, with Dec-12 finishing the day down a quarter of a cent.
Coincidence? The author thinks not, but he made the same analysis for soybeans just
in case, this time using the most active Nov-12 contract.
By this point, it will not surprise readers that the soybean chart
matches the corn chart very closely. On every single occasion that fund money
was increasing their net long, the Nov-12 price closed higher, and every time they
were net sellers, it closed lower.
There was one occasion here too when fund activity was said to have been even
on the day – 6 September, when Nov-12 beans finished half a cent lower.
Once again, the daily change in price seems greatest during the sessions when
funds have been particularly active as either sellers of buyers.
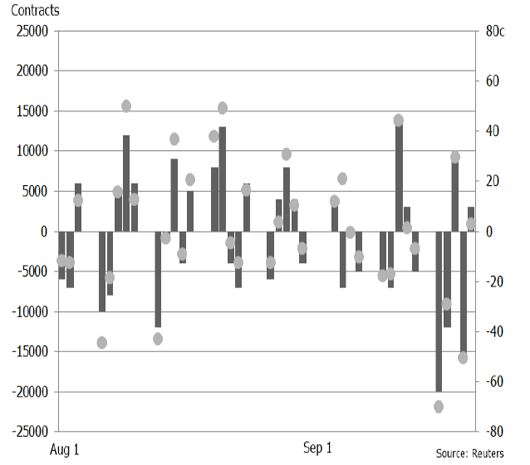
As of 18 September 2012, - the most recent set of data available - 'managed money' –
a proxy for funds – held a net long position in Chicago soybeans of nearly
210,000 contracts. That is the equivalent of around 28.5 million tonnes of
soybeans, or around 40 per cent of this year's entire US production.
That is a very significant proportion of the crop to be held in speculative hands.
The short-term fundamentals continue to indicate that prices could move higher
between now and when new crop South American soybeans arrive on the market
in the spring, with essentially just this year's drought-reduced US crop to keep
the world supplied with soybeans this winter.
However, with funds holding such a large long-holding, we have to be wary of
something coming along that might spook them into wanting to exit the bulk of
their position. In the recent past, such unpredictable events as the Japanese
tsunami and ensuing nuclear crisis, civil unrest in North Africa and the Middle East
and the UN intervention in Libya have all triggered a mass exodus of fund money
from the markets.
There is also the ongoing European debt crisis, with fears that Greece
were potentially about to default on their debt having already caused one or two
market wobbles. Question marks remain over Spain and Italy too, with an
escalation of those also having the potential to unsettle fund nerves.
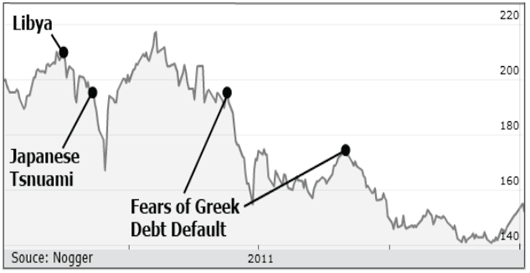
Back in 2011, London wheat fell £38 per tonne in a week mid-March on uncertainty
of the implications of the Japanese earthquake and subsequent tsunami, before
recovering almost all of those losses within a few days.
By mid-June, fears of a Greek debt default saw London wheat drop £40 per tonne in
a fortnight, and another wave of Greek jitters triggered a further near £30 per tonne
drop in four weeks in September.
All the evidence points to fund money inflows and outflows being the number one
factor in influencing price movements in the grain markets in the current climate.
Unfortunately, trying to predict these in advance is proving nigh on impossible,
certainly sudden outflows in particular can frequently be triggered by external
factors that are impossible to foresee like Acts of God and political decision
making.
Biofools – Is A U-Turn On The Cards?
There is currently a growing backlash developing in Europe in particular
concerning the real environmental impact on producing biofuels from food crops,
and there are signs of a U-turn on earlier targets to meet 10 per cent of the transport
sector's needs from renewable biodiesel by 2020.
The European Commission is now said to be proposing to limit the share of
energy from food crop-based biofuels, such as wheat and rapeseed, to less than
five per cent of the total energy consumed in the transport sector in 2020. There are no
limits imposed by the Commission at the moment. The move potentially marks a
radical change in policy.
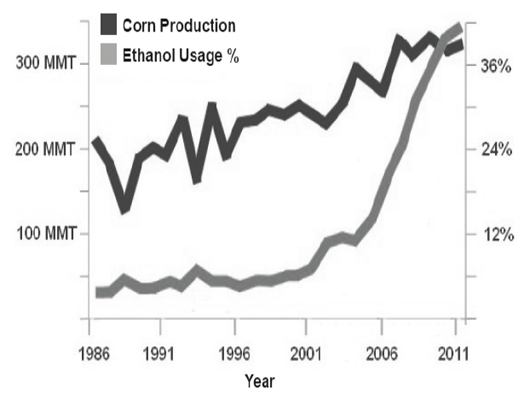
In the US, around 40 per cent of the corn crop currently goes to make ethanol in an
industry that has exploded in the past ten years, again due to government
mandates.
The steep rise to record levels that we have seen in corn prices this year has
prompted many, including the United Nations, to put pressure on the US to at
least temporarily suspend the five-year-old Renewable Fuels Standard (RFS), that
states that US fuel companies are required by law to ensure that 9 per cent of their
gasoline pools are currently made up of ethanol.
A change of heart in an election year may be unlikely but 2013 could be a
different kettle of fish.
(Source: USDA/Bloomberg)
The Euro Crisis and a Grexit
A narrow victory for the pro-austerity New Democracy party in the Greek
elections in June helped avoid what was looking like a Greek debt default, at least
for now. However, civil unrest Greece is ongoing as the government try to push
through the austerity measures required to meet IMF/EU/ECB imposed criteria to
keep the loan money coming through.
Anything could happen there at any time to spark a new wave of 'risk off' flight
to safety for fund money, which would almost certainly include a different type of
Grexit to the one you have already heard about – a grains exit.
Meanwhile Spanish banks have already had one bail-out, and could shortly require
another, although the government themselves have managed to avoid such a
capitulation up until now. However, pushing their own austerity measures
through with unemployment at 25 per cent and rising, and the country gripped by
recession will be far from easy. Some would say impossible.
And then, of course, there are Italy and Portugal and Ireland.
The IMF/EU/ECB have managed to contain the individual forest fires that we have
seen break out over the last couple of years, what happens if two or three ignite
all at the same time? Is there enough water (money)? And will the German firefighters have the stomach for it? There are some schools
of thought that suggest that the best way forward for the Euro might be for
Germany themselves to leave it.
The Author's Take on It All
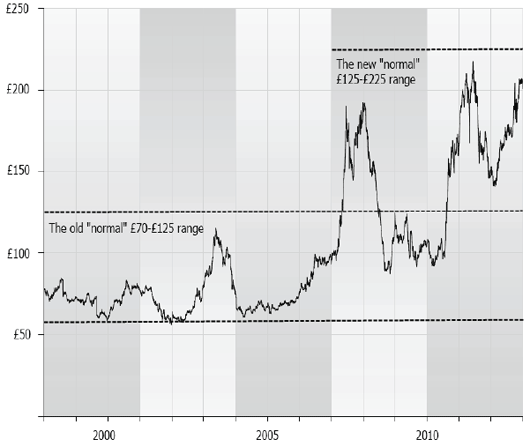
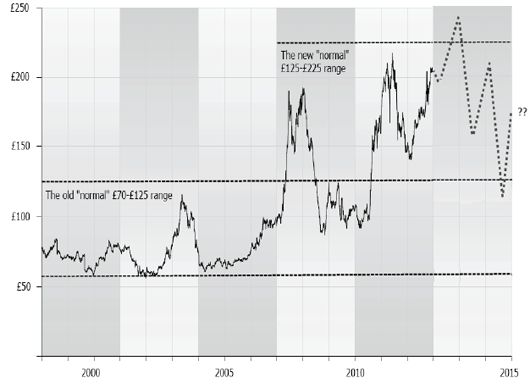
As things stand, volatility is the new normal. A bit like buses, some farmers have waited all their lives for an opportunity to sell feed wheat at £200 per tonne and suddenly two come along almost at once.
(Source: HGCA)
The old normal has gone out of the window, the new normal seems to be £125-
£225 for London wheat, but the author would not rule out a test of both the upper and lower
end of that scale in the not too distant future.
The all-time high closing price for London wheat was £217.50 per tonne set on 20
April 2011. The author can see that being taken out within the next couple of years, quite
possibly in the spring of 2013, if the fundamentals are sufficient to back up fund
activity we could easily break out of 'the new normal' to the upside.
He can also envisage a scenario however where a wave of fund selling and a flight
to safety out of commodities in general, if also backed up by bearish fundamentals where prices could conceivably break out to the downside and maybe get close to £100 per tonne again – it was after all little more than two years
ago that we last visited this territory.
Similar extreme volatility is also easy to foresee in corn and soybeans. The cure
for high prices is high prices, they say. Farmers will clearly be looking to
maximise their profitability by planting as much of these commodities as they can
at these price levels.
In South America, where plantings are just getting underway for the 2013
harvest, record production levels are expected for soybeans from all the major
nations:
| Country | Forecast Production (million tonnes) | Increase per cent |
|---|---|---|
| Brazil | 82.00 | +23 per cent |
| Argentina | 56.00 | +37 per cent |
| Paraguay | 8.60 | +115 per cent |
| Uruguay | 3.10 | +94 per cent |
| Bolivia | 2.45 | +11 per cent |
| Source: Oil World | ||
The Future Could Look Something Like This
The author is not predicting these specific movements in these specific years but sees the large price swings that we have seen in the last four to five years persisting, and possibly even getting more extreme.
(Source: HGCA)
Charts for corn and/or soybeans would be broadly similar; where corn used to frequent the $3-4 per bushel trading range, it could now be $4-8 per bushel. Ditto soybeans: $5-7.50 per bushel becomes $10-20 per bushel, with 100 per cent in values between the top and the bottom of the market the new normal.
Further ReadingYou can view other papers presented at the conference by clicking here. |
December 2012


