

The Economics of PRRS
Porcine reproductive and respiratory syndrome (PRRS) is an economically significant disease that can impact both the breeding and the wean-to-finish phases of production. (1)The clinical signs in the breeding herd are characterized by increased reproductive failure, such as the inability to conceive, increased late term abortions, premature farrowing, increase in mummified fetuses and stillborn pigs and markedly weak piglets most of which die prior to weaning. Infections in the wean-to-finish phase are characterized by a sudden onset of fever, often resulting in inappetance, coughing, and pneumonia. (2) These symptoms may have their severity influenced and increased by an impaired health status of the herd prior to the PRRS infection. This array of symptoms produces slow growth, impaired feed efficiency, increased mortality and a loss both in total pigs marketed and the value per kg of many more hogs than is usual among those reaching harvest. In addition, the PRRS infection may predispose a high health herd to subsequent outbreaks of other diseases.
Understanding the Economic Losses in the Breeding Herd
Since many of the breeding herd production metrics are interdependent, we can summarize the key economic impacts first as decreased annual turns and increased per unit costs of production arising from reduced annual weaned pig production. Economically this is a decline in asset use efficiency which is typically measured by the metric asset turnover (gross sales/average asset value). A loss of financial efficiency also results from less revenue and increased costs and is the result of increased breeding female mortality and involuntary culling rate, increased veterinary and medicine costs, increased labor costs etc. and reductions in total weaned pigs or weaned pigs per breeding female/year sold due to increased preweaning mortality. The classic economic metric for financial efficiency is net profit margin (net income/gross sales), the rate (percentage) at which sales revenue is realized as profit. (3) (4) Reduced production creates an opportunity loss in revenue, which reduces net profit margin. Fixed costs of the breeding herd cannot be reduced as production falls and most of the variable costs such as feed, while slightly reduced (due to inappetance and mortality of breeding females in the initial phase of infection) are still substantially incurred without realizing full expected production. Total costs also rise from items such as increased medication and veterinary services, increased labor costs and the increased costs of post infection prevention strategies (all affecting Net Profit Margin).
Understanding the Economic Losses in the Wean-to-Finish Phase
The key economic impacts of PRRS in this production phase are four-fold and begin with the reduction of average daily weight gain (ADG) due to reduced feed intake. Even after the animals exhibit no clinical signs of the disease, diminished growth has a lasting impact as the group’s ADG rarely reaches pre-infection levels. Since the proportions of total daily feed intake are shifted to maintenance needs as growth slows, feed conversion ratios are also increased. Mortality typically rises above normal rates to between five and fifteen percent and even though the majority of pigs may die in the first half of the wean-to-finish phase, their wasted feed consumption damages the average feed conversion ratio and reduces net profit margin. (5) Slow growth lengthens finishing times reducing total annual output and the empty spaces created by increased mortality both conspire to decrease asset use efficiency. Total farm throughput is reduced, total and per unit costs rise, and prices for output are typically reduced due to a substantial increase in light weight and/or cull pigs at marketing.
Estimating Economic Impacts with Stochastic Modeling
A thorough review of the literature regarding economic impacts of PRRS reveals the most common method to estimate impacts, regardless of the country where the research originates, is the partial budget framework. (4) (6) Though simple and systematic, there are many recognized shortcomings to partial budgeting. (7) Therefore we present an alternative method which offers superior estimates and demonstrates that use of typical partial budgeting techniques, may systematically underestimate the costs associated with disease outbreaks and other events evaluated by this method. We know the impact of the PRRS virus on individual breeding female productivity and individual wean-to-finish pigs is quite variable even on a single farm and can range from zero economic impact up to a fatality. (8) The best way to accurately characterize these varying impacts of PRRS across all of the animals in a given herd is as a distribution of impacts rather than a single point estimate. In the same way, the economic impacts of PRRS depend on the prices of output and costs of inputs (especially feed ingredients) prevailing at the time and duration of the outbreak, which can be many months long. Costs of items and prices of feed (feed ingredients) as well as market prices for piglets and hogs vary widely over time but can be mathematically characterized using distributions. Utilizing these distributions is highly advantageous in that the analysis transitions from accounting the results of a single, actual outbreak to a more comprehensive understanding of the economic impact of a representative outbreak. A distribution, as opposed to an average measure, more accurately portrays the effects of PRRS over time since diseases are transmitted between individuals or groups over time. (9) (10) This differential impact of disease on individual animals or groups within a herd may produce sub-populations of animals which have their own distributions of clinical expressions and resulting economic impacts. (11) If a PRRS infection creates a sizeable group (or groups) that lag far behind a more normal subpopulation in growth, using the average weight of the groups will likely produce misleading and inaccurate estimates. Such as the barn emptying date, pig or piglet sales value (or culling percent) and especially feed efficiencies in growfinish. Estimates which rely on prices and costs at a single point in time or the average of a past period, like last year’s average price, produce unique estimates that are only valid if all of the conditions, prices and impacts which produced them somehow exactly reappear in the future. Another advantage of distributions are confidence intervals which can be produced around the estimates, greatly facilitating sensitivity analysis. For instance, we can ask, what is the probability that a PRRS outbreak in finishing produces losses per pig above €10/head, above TABLE 1 – Parity distributions and productivity €5/head, above €2/head across all market prices of pigs and input costs likely in the planning horizon?
Measuring Economic Impact
In this paper we use the DuPont disaggregation of ROE (12), which is a common way to understand the underlying causes, in broad terms, of the composition and any changes in ROE over time. The DuPont disaggregation creates a metric for asset efficiency, financial efficiency, and debt (leverage) efficiency from ROE. Mathematically, ROE and its disaggregation looks like this:
ROE = Net Income/Average Equity (during the period the net income was created)
Disaggregating we have: ROE = Total Revenue X Net Income X Average Assets Average Assets Total Revenue Average Equity [ASSET TURNOVER] [NET PROFIT MARGIN] [DEBT EFFICIENCY]
The Economic Impact of PRRS in the Breeding Herd
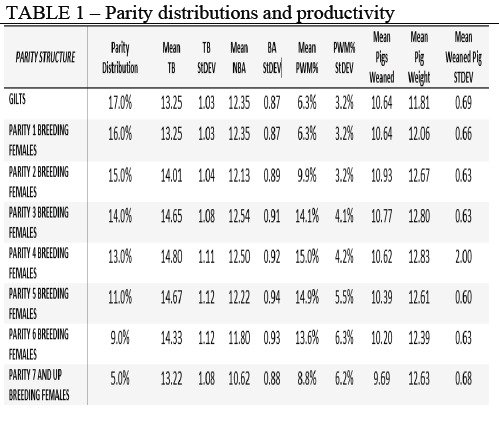
To estimate the full economic impact of a PRRS outbreak in the breeding herd, we undertake a detailed stochastic simulation and optimization of a farm with 650 breeding females. Table 1 contains the assumptions we make regarding the initial parity distributions and their expected productivities when the herd is PRRS negative. Initially the herd is turning at the average rate of 2.35 litters per inventoried female per year. Average total born initially is 14.01, born alive is 12.10 and pigs weaned averages 10.89 piglets per breeding female or 25.6 pigs weaned per breeding female per year. We developed these initial values to represent the current breeding herd productivity of the top third of European Union production (Belgium, France, Germany, Denmark, Ireland) and the U.K. acknowledging some regions produce more while others less and that there are excellent producers who exceed their country and region average as well as some that do not reach their own country or regional average. (13)
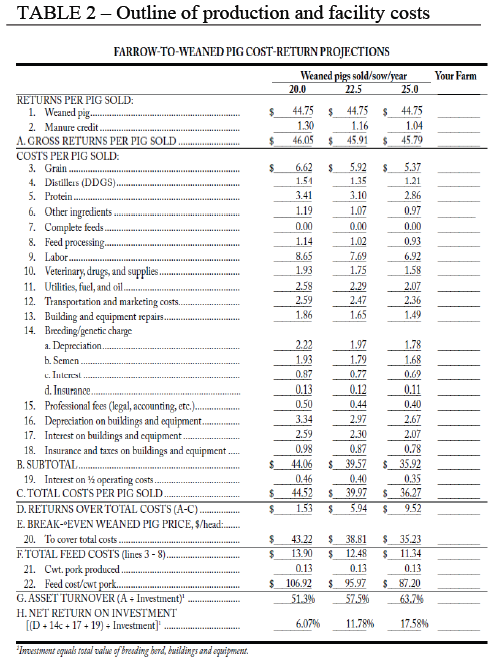
The framework for the detailed costs of facilities and production is listed in Table 2. Detailed costs of production for capital and other items were taken from a published enterprise budget for farrow-to-wean pig production by the agricultural economists at K-State University in Kansas, USA. (14) Three herd productivities are given in the budget. We selected the cost structure for the high performance farm as it fit closely, the current top third EU average productivity. The costs in the budget were harmonized with average EU costs of production through reference to several published EU cost of production sources. (15) (16) Feed ingredient physical units were taken from these same budgets but the corn and soybean meal prices were rendered stochastic using a correlated set of distributions for corn and soybean meal prices estimated from monthly average price data occurring over the last 4 years for the EU. (17) (16) In this way, the gestation and lactation feed cost, a key economic component of piglet production is allowed to vary over the same patterns of prices present in the extended recent history.
Modeling Impacts of a PRRS Outbreak
PRRS impacts by parity for total born and number born alive were adjusted using a published study which provides expected changes, by parity, for number born alive. (18) Changes in preweaning mortality can be dramatic with PRRS and the literature has a wide range of reported values. After consulting various sources, the parity means for preweaning mortality were uniformly increased across every parity in the model by approximately 34% of initial value. This caused the weighted average mean change for preweaning mortality to increase from 10.8% pre-PRRS to about 14.5% after the outbreak. Other changes modeled included a 60% increase in veterinary and medical costs during the outbreak (from €1.80/weaned pig to €2.88/weaned pig). (19) (4) Labor costs per weaned pig vary widely across the EU typically much higher in the north and lower in the south. The increase in labor cost during a PRRS outbreak partly depends on the farm specific actions elected to mitigate the multiple issues that arise from an outbreak. We chose to increase labor costs per weaned pig 10% (from €9.00 to €9.90) to cover the basic tasks of removal of deads, extra care provided for both sows and weak piglets and other associated tasks of an outbreak. (4) Breeding herd mortality with a PRRS outbreak is highly variable depending on the level of herd immunity to the specific virus producing the outbreak. Except for naïve herds, additional breeding herd mortality is expected to be low, in the 1-5% range. (4) (8) In general, we have captured the economic effect of expected breeding herd mortality in the reduced productivity of the herd (turns and pigs produced). The cost of replacing breeding females was considered roughly equal with the incremental improvement in breeding herd genetic capability which the typical replacements would bring.
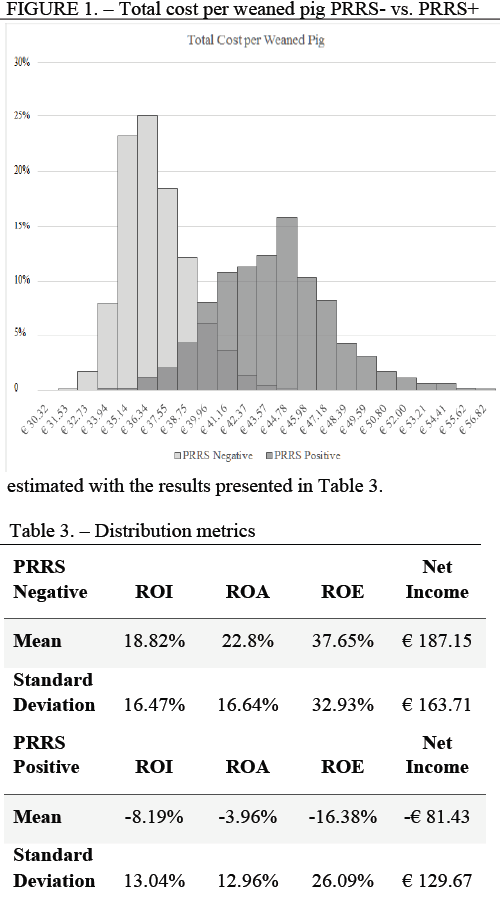
Figure 1 shows the modeled distributions of costs per pig with and without a PRRS outbreak. The darker areas are the overlapping of the distributions. Prior to the outbreak, the production of weaned pigs resulted in a loss per head only 16% of the time with profits expected to average €7.14 per head, marketing 16,630 piglets. The range of profitability across PRRS-negative distributions of piglet production combined with the varying costs of production (including variation over key feed ingredient price ranges) was estimated to lie between -€12.70 and €19.57 per head. During a PRRS outbreak the average loss per piglet was estimated to -€4.36 (ranging from -€21.34 to €14.71) across 13,498 total pigs weaned. The most significant difference is that below breakeven portions of the range could be expected 72% of the time compared to only 16% for PRRS-negative breeding herds. A comparison of the pre- and post-PRRS outbreak financial efficiency of the farm was estimated with the results presented in Table 3.
The Wean-to-Finish Phase: Subpopulations of Differently Affected Pigs
In this paper we have the opportunity to estimate the economic impact of PRRS in the wean-to-finish phase of production using a stochastic bio-economic model designed to estimate subpopulations of differently affected animals within the total group. We use the control data from a vaccine trial conducted by Boehringer-Ingelheim which divided a baseline group of weaned piglets into several groups and then challenged some of the groups with differing quantities of a PRRS virus, (challenge levels were described as Log1, Log2, Log3 and Log4). The Log# designations indicate the amount of virus in each successive dose, e.g., Log1 vs. Log2 vs. Log3 etc. was 10 times the previous dose. By using the control pigs, we are able to measure the impact of these graduated levels of challenge across the groups without vaccination mitigation. Our purpose here is to measure the differential economic impact of these created subpopulations and understand how that result might vary from simply using closeout data averaged over the group as a whole. Because the data set did not contain a control group which was both unvaccinated and not challenged, we use a vaccinated group (Ingelvac) which was not challenged with the virus to represent our “healthy” baseline. All of the pigs in each group were weighed 0, 27, and 70 days post-weaning, with the challenge doses administered on day 28.
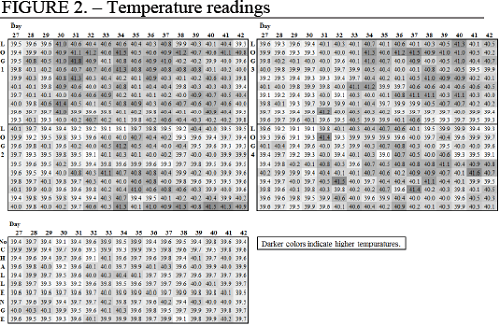
Various measurements were taken on the pigs including daily temperatures, which were recorded each day for each pig from day 27 through day 70. Visual inspection of a “heat map”, see Figure 2, representing the varying pig’s temperatures showed clear and different patterns of change and clustering across the groups as well as across the days of measurement. This suggests subpopulations of response within the group of piglets taken as a whole. In this first study, we chose to create the subpopulations around the levels of challenge recognizing there are other logical ways to do this (by recorded temperature on certain day ranges and/or behavioral responses, etc.) The actual number of animals in each challenge group was 10. We fit a distribution of the pig weights on day 0 (weaning) for each group and selected a leftskewed Weibull or Weibull-like distribution that conforms to the typical distribution of pig weights at weaning. The mean and standard deviation pairs at weaning (day 0) for the healthy pigs and Log challenge groups 1-4 in order were: 5.60:1.25; 5.39:1.12; 5.55:0.92; 5.65:1.28; and 6.0:0.99. Each subpopulation was created by randomly selecting 300 pigs from these respective estimated distributions to create the wean-to-finish sample. In the case of the PRRS-negative group we used a larger sample from the Ingelvac/No Challenge distribution to “fill the building”. For the PRRS case we assumed equal numbers of the healthy group and each level of infection (Log1, Log2, Log3, Log4 levels) among the total pigs in the sample.
Growth and Marketing
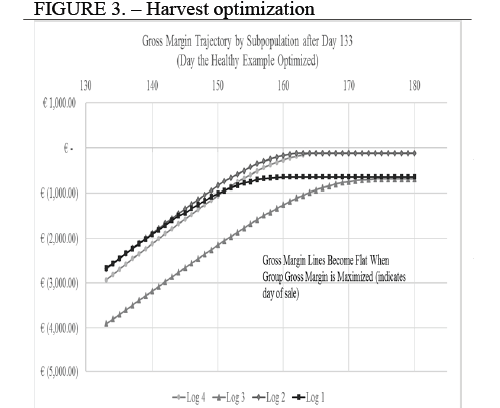
Separate second degree polynomials were fit to the recorded weights over time for each subpopulation (including the healthy one) and these were used to estimate growth from day 70 over the grow-finish period. We imposed a linear decline in the co- efficient of variation (CV) in each group’s weights to bring the starting point CV toward an ending trajectory of CV = 9 when the average weight reached 125kg (even though the pigs were all marketed at mean weights in the 106-108kg live). This mirrors the reduction in CV typical of grow-finish herds as the average weight increases until harvest. Harvest took place for each group on the day it reached its maximum total return over feed cost (gross margin), see Figure 3. We compared the challenged groups to the healthy pigs so that once marketing took place for the fastest growing (vaccinated, not challenged) group on day 133, the remaining pigs paid a building occupancy cost equal to the building’s actual fixed costs per day if they were to continue on vs. being sold. This is a proxy (though often an underestimate), of the cost of delaying the building from being filled by the next group to accommodate slow growing pigs if a tight pig-flow schedule is enforced. It can also be used to value the delay in a continuous flow space as total annual production must be reduced when growth slows if space is unchanged.
The pigs were priced in a European harvest matrix using the distribution of the EU SPP (Standard Pig Prices) for the period August 2013 through July 2016 (Mean = €1.40/kg carcass). (13) The harvest matrix only assessed penalties to the base price based on weight deviations from preferred weight (as we had no data to model other quality differences, like lean percent). The ideal weight range with no discount was from carcass weight 84 – 108kg. Weight discounts were from 0.02 euro to a maximum of 0.09 euro/carcass kg on the light side down to a total weight of 45kg. Weight discounts were from 0.02 euro to a maximum of 0.20 euro/carcass kg on the heavy weight side up to 112 kg carcass. Weight ranges containing these fixed discounts were about 3-5kgs wide.
Feed Consumption
Feed consumption was estimated individually for each animal each day from an average daily feed intake function. The total daily feed intake for each animal was disaggregated into a maintenance and growth component. The digestible energy (DE) for maintenance was based on the metabolic weight of the animal (using exponent 0.60) and an average diet ME of 3,500 kcal. (20) The growth portion was calculated as a residual from the group level average daily feed intake function and then weighted by the percent each individual animal’s weight was of the mean weight of their group on that day. This resulted in slower growing animals consuming less feed at the same weight compared to more rapidly growing animals when they passed through that weight. All wean-to-finish groups optimized gross margin at about 106-108kg live weight. However, their days to optimization varied widely. Days to finishing weight were 133 for the healthy animals and from 161-175 for the PRRS affected groups corresponding to wean-to-finish growth rates of 718 grams/day for the healthy group and an average of 575 grams/day for the PRRS outbreak groups. Feed efficiencies (5.5kg - 106kg) for the healthy group and Log1-Log4 groups are reported as follows: healthy group at 1.83. Log1 – Log4 were 2.00, 1.95, 2.03 and 1.95 respectively. On average, this represents an 8% improvement in FCR for the healthy animals grown to essentially the same finishing weight. Growth rate experienced a 20% reduction for PRRS outbreak animals when taken as an average across the subpopulations and compared to healthy pigs.
Other Costs of Production
Detailed costs of production for the wean-to-finish phase were taken from the wean-to-finish enterprise budget complementary to the breeding herd cost source, also produced by the agricultural economists of K-State (Kanas State University, USA). (21) Costs of production vary widely across the EU so some will find these assumptions high while other may find them low. The K-State costs were harmonized to available EU database values and translated to the euro at the current rate (1.12 U.S. dollar to euro). (22)
Financial Results
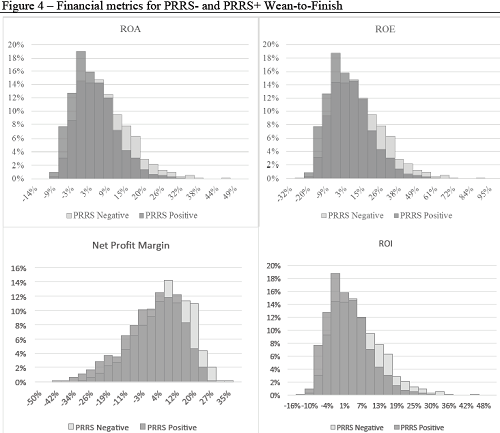
We produced estimates for the different average costs of a weaned pig under the assumptions of a PRRS-negative case and a PRRS outbreak case, as seen in Table 4. However, we only use the EU piglet market price to load the wean-to-finish scenarios. We do this so that in comparing the two finishing situations, we only compare costs associated with PRRS arising after weaning for these scenarios. We estimate the net return per pig for the no challenge group to be €22.17/head. For PRRSchallenged subpopulations, the average was €10.20/head if each subpopulation of sick pigs is allowed to remain in the finishing phase until it reaches its own optimal net income. In this situation, the turns of the building are reduced on an annual basis from 2.68 turns to an average 2.17 turns. A total of 659 fewer pigs are sold due to both mortality increases and slower building turns.

The standard deviation for the PRRS-negative gross margin of €42.74 (€41.06 with PRRS) was high reflecting the wide swings in both hog prices and feed ingredient prices over time. We can now answer the previous questions as a range, see Figure 4. The finisher can expect to lose €20.00/head or more with a PRRS-outbreak in the finisher about 20% of the time (16% for healthy pigs). For a €10.00/head or more loss about 35.4% of the time (26% for healthy pigs) and finally, for a €5.00 loss per head about 40% of the time (30% of the time for healthy pigs). The finisher could expect to have a result less than breakeven about 44% of the time in the case of a PRRS outbreak. For a healthy herd about 34% of the time. These losses are associated with the performance of the farm and the fluctuating EU costs of feed and hog prices.
Summary
To summarize the key results as differences, the net income per breeding female in a healthy herd not affected by PRRS is expected to be €182.81. For a PRRS outbreak, we estimate the representative profit expectation to fall to -€88.56. This yields a difference of -€271.37.
In the case of a stand-alone wean-to-finish farm we estimate the profit expectation for a wellrun farm not affected by PRRS to be €22.17/head. In a PRRS outbreak we expect this to become €10.20/head for a difference of -€11.97 per head marketed. Standard deviations of all profit measures are contained above in the tables.
References
1. Holtkamp D, J K, Zimmerman J, Neuman E, Rotto H, Yoder T, et al. Economic Impact of Porcine Reproductive and Respiratory Syndrome Virus on U.S. Pork Producers. Animal Industry Report. 2012. 2. Muirhead M, Alexander T. The Pig Site. [Online].; 2014. Available from: http://www.thepigsite.com/pighealth/article/142/porcinereproductive-and-respiratory-syndrome-prrs/. 3. Bourne S, Tyler-Pickard J, Close W. Pig Progress. [Online].; 2013. Available from: http://www.pigprogress.net/Home/General/2013/12/Thecost-of-lost-opportunities-in-sow-production-1386837W/. 4. Nieuwenhuis N, Duinhof T, van Nes A. Economic analysis of outbreaks of porcine reproductive and respiratory syndrome virus in nine sow herds. Veterinary Record. 2012. 5. Neumann E, Kliebenstein J, Johnson C, Mabry J, Bush E, Seitzinger A, et al. Assessment of The Economic Impact of Porcine Reproductive and Respiratory Syndrome On Swine Production in The US. Journal of the American Veterinary Medical Association. 2005. 6. Holck P, Polson D. Financial Impact of PRRS. 2003 PRRS Compendium. 2003: p. 51-58. 7. Schauer W. Partial budgeting: Analyzing changes on your farm. [Online].; 2011. Available from: http://msue.anr.msu.edu/news/partial_budgeting_analyzing_ changes_on_your_farm. 8. Baysinger A, Dewey C, Straw B, Brumm M, Shmitz J, Doster A, et al. The effect of PRRSV on reproductive parameters in swine herds. Swine Health and Production Vol. 5, No. 5. 1997;: p. 173-176. 9. Wills R, Doster A, Galeota J, Sur JH, Osorio F. Duration of Infection and Proportion of Pigs Persistently Infected with Porcine Reproductive and Respiratory Syndrome Virus. Journal of Clinical Microbiology. 2003 January; 41(1). 10. MacKenzie K, Bishop S. Developing Stochastic Epidemiological Models to Quantify the Dynamics of Infectious Diseases in Domestic Livestock. Journal of Animal Science, Vol 79, No. 8. 2001;: p. 2047-2056. 11. Dee S, Joo H, Henry S, Tokach L, Park B, Molitor T, et al. Detecting subpopulations after PRRS virus infection in large breeding herds using multiple serologic tests. Swine Health and Production. 1996 May; 4(4). 12. Melvin J, Boehlje M, Dobbins C, Gray A. The DuPont Profitability Analysis Model: An E-Learning Application and Evaluation. In Federal Reserve Bank of Kansas City, Agricultural Finance Markets in Transition; 2003. 13. Agriculture and Horticulture Development Board. pork.ahdb.org.uk. [Online].; 2016 [cited 2016 September 2. Available from: http://pork.ahdb.org.uk/pricesstats/costings-herd-performance/eu-sow-productivity/. 14. Dhuyvetter K, Tonsor G, Tokach M, Dritz S, DeRouchey J. Farrow-to-Weaned Pig Cost-Return Budget. ; 2014. 15. Agriculture and Horticulture Development Board. 2012 Pig Cost of Production in Selected Countries. Annual Production Report. , BPEX; 2013. Report No.: ISBN. 16. Horste R. Managing pig production costs key to profitability. [Online].; 2011. Available from: http://www.wattagnet.com/articles/11242-managing-pigproduction-costs-key-to-profitability. 17. Index Mundi. Commodity Prices. [Online].; 2016. Available from: http://www.indexmundi.com/commodities/. 18. Lewis C, Torremorell M, Bishop S. Effects of porcine reproductive and respiratory syndrome virus infection on the performance of commercial sows and gilts of different parities and genetic lines. Journal of Swine Health and Production. 2009. 19. Pejsak Z, Markowska-Daniel I. Losses Due To Porcine Reproductive And Respiratory Syndrome In A Large Swine Farm. Comparative Immunology, Microbiology & Infectious Diseases. 1997; 20(4): p. 345-352. 20. Stein H. The New Swine NRC. In XXVIII Curso de Especialización: Avances en nutrición y alimentación animal; 2012; Madrid. p. 17-29. 21. Dhuyvetter K, Tonsor G, Tokach M, Dritz S, DeRouchey J. Swine Wean-to-Finish Cost Return Budget. ; 2014. 22. Agriculture and Horticulture Development Board. AHDB Pork. [Online].; 2016 [cited 2016 9 02. Available from: http://pork.ahdb.org.uk/prices-stats/costings-herdperformance/eu-cost-of-production/. 23. Dijkhuizen A, Brouwer J, Frankena K, de Jong M, Voets RVJ, Komijn R. PRRS: Effect on Herd Performance After Initial Infection and Risk Analysis. Veterinary Quarterly. 2011.
Dennis DiPietre, Ph.D. and Lance Mulberry, BA
If you want to read more abstracts like this one visit: https://www.prrs.com/en/publications/abstracts/


