

Review of Pig Sector in 2012 and Outlook for 2013
Michael McKeon of the Pig Development Department of Teagasc discussed the main trends in pig production in the Irish Republic and the EU at the organisation's Outlook 2013 conference 'Economic Prospects for Agriculture' held in December 2012.Introduction
In 2012, the Irish pig industry continued to experience the lowest profitability in more than a generation. The escalation in feed prices which began in 2010-2011 has continued throughout 2012. The market price for pigmeat also rose in 2012 but not to the same extent as feed prices. This has resulted in an extension of cost squeeze that the industry has suffered over the last two years. The industry requires a significant and sustained period of profitability to recoup the accumulated losses it has sustained.
Irish Pig Production Costs
The cost of producing pigmeat in Ireland can be decomposed into feed cost and non-feed cost. Feed currently constitutes 75 per cent of the total cost of producing a pig with the non-feed inputs contributing the remaining 25 per cent. The largest volatility over the last two years has concerned the feed cost input.
Irish pig feed costs
The Irish pig industry utilises a relatively small selection of feed ingredients,
principally wheat, barley and soyameal with small inclusions of maize, rapeseed and
assorted oils. Some of these feed ingredients are not grown in Ireland, nor is Ireland
self-sufficient in the other feed ingredients. Therefore, the pig industry must import a
significant volume of its feed ingredients.
This leaves the industry very exposed to
fluctuations in the global prices for these key ingredients. Sudden and unexpected
international events drive up ingredient costs which affects Irish importation costs. In
recent years, we have seen drought conditions in the Russian region, Brazil and the
US having a particularly upward effect on feed ingredient prices. Table 1 shows the
effect of drought on Russian exports in 2010/2011 and 2012/2013.

The reduction in Russian exports has a larger effect on global trade then the decrease in volume would suggest as the Russian wheat price generally provides the 'price floor' for wheat. Figure 1 illustrates the volatility of wheat price since 2007.

(Source: IFIP)
In 2010/2011, the scarcity of wheat as a protein source increased the rate of substitution to soyabeans with a resultant escalation in the price of soyabeans in late 2010. However, the subsequent bumper South American soyabean harvest in spring 2011 eased the pressure of soyabean supply leading to a corresponding drop in price. Unfortunately this was not the situation in 2012 as a soyabean drought in South America increased the soyabean price dramatically, thereby eliminating any effect of substitution for wheat.
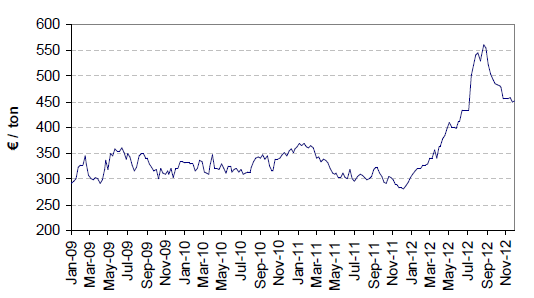
(Source: IFIP)
The price rise for the main pig feed ingredients from August 2010 onwards led to the Irish composite pig feed price increasing in November 2012 to its highest level in over 20 years. Annual Irish pig feed prices are shown in Figure 3.
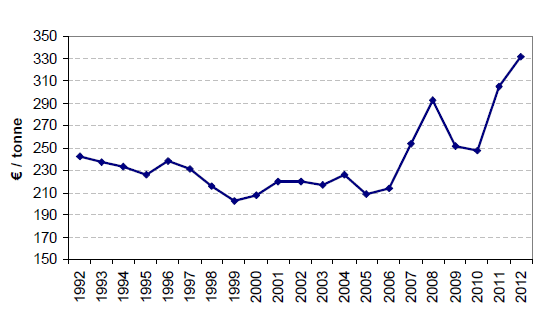
(Source: Teagasc Pig Development Department)
The composite compound feed price increased by €75 per tonne from January 2012 to a peak in November 2012. The price then stabilised in December 2012. Monthly pig feed prices for 2012 are shown in Table 2.
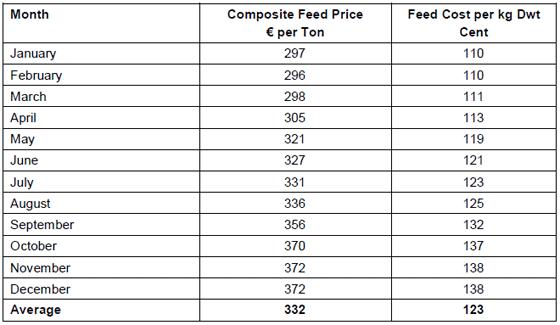
(Source: Teagasc Pig Development Department)
The annualised feed cost per kilo dead weight of 123 cents is significantly higher then in 2011 (112 cents) and 2010 (93 cents). The increased feed cost during 2012 caused continued serious cashflow difficulties for producers, especially during the summer months when the feed price rose but the pig price remained static.
Non-feed costs in Irish pig production in 2011
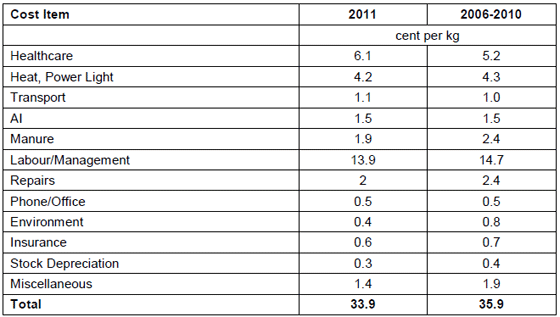
The non-feed costs can be partitioned into Common Costs and Herd Specific Costs. The common costs apply on all units and represent the largest component of nonfeed costs. The data quoted for Irish industry is collected from herds using the Teagasc Pigsys herd recording system which records, analyses and benchmarks herd productivity and financial performance. The costs quoted are based on 2011 data which is the most recent analysis of annualised costs available. Common costs are itemised in Table 3.
(Source: Teagasc Pigsys Report 2012)
The common costs in 2011 were two cent lower than the previous five-year average. A larger reduction may have been anticipated in 2011 but the industry had previously experienced low profits margins in 2008 which resulted in a four cent reduction in common costs. This low cost base was further reduced in 2010 primarily by reducing the labour/management input cost by 1.1 cent.
Herd-specific costs in Irish pig production in 2011
These costs include interest payments and building depreciation and vary greatly from unit to unit depending on the age of the unit and the level of continuous capital investment undertaken in the business. Herd specific costs are itemised in Table 4.

(Source: Teagasc Pigsys Report 2012)
The reduction in interest and depreciation costs in 2011 reflects the poor profitability of the industry in the preceding years which therefore limited capital investment.
Total cost of Irish pig production in 2012
The estimated cost of production in 2012 (based on 2011 non-feed costs and 2012 feed costs) was 166 cents per kilogram deadweight for pigs delivered to the slaughter plant. The level of this cost varied from a relative low of 153 cents/dwt in January 2012 to a high of 181 cents/dwt in November and December 2012. This variation was due to the fluctuating feed cost.
Irish Pig Prices in 2012
The estimated average pig price in 2012 was 166 cent which was 21 cent above the previous five-year average (2006-2011) of 145 cent. Monthly Irish pig prices are shown in Table 5.
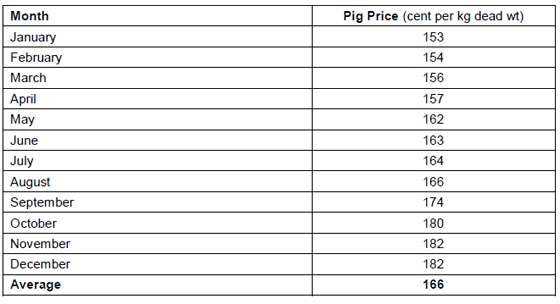
(Source: Teagasc Pig Development Department)
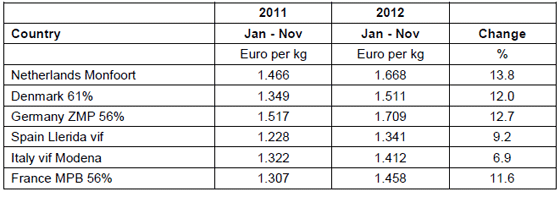
The higher Irish pig price in 2012 was a combination of a more vibrant export market outside the EU and a response to the higher cost of production. The higher pig price was also reflected across other European Union countries as shown by the survey results in Table 6. This survey of the principal European pig prices revealed annual increases of between seven per cent and 14 per cent year-on-year.
(Source: MPB)
Profitability of Irish Pig Production in 2012
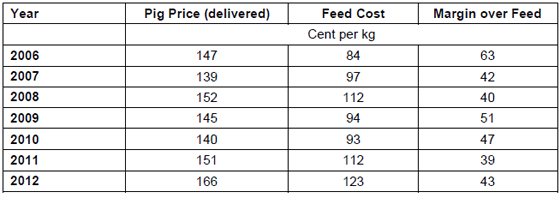
The margin over feed costs per kg deadweight in 2012 has continued the pattern of recent years by fluctuating widely as illustrated in Table 7.
(Source: Teagasc Pig Development Department)
In Table 8, the 2012 margin over feed is compared to the average margin over feed of the last five, 10, 15n and 20 years and this clearly shows the difficult trading conditions and low profitability of recent years.

(Source: Teagasc Pig Development Department)
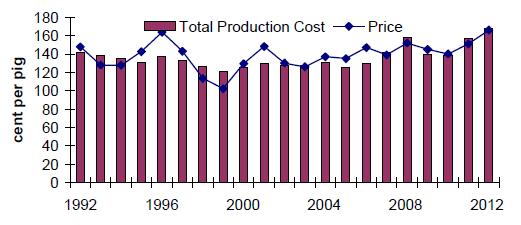
When an average figure of 45 cents per kg (estimated by the author as a requirement to meet all production costs including financial repayments) is added to the feed costs incurred during 2012, it is clear that an operating margin deficit existed in Irish pig production for much of 2012. Figure 4 shows the pig price received when compared to the total production cost (feed + 45 cent) since 1992.
(Source: Teagasc Pig Development Department)
Irish Pig and Sow Numbers in 2012
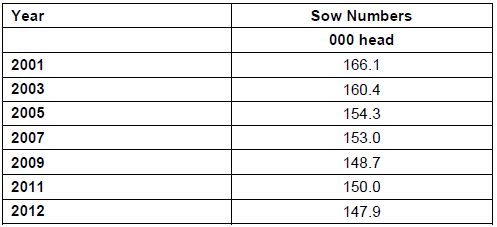
The latest Teagasc sow survey of commercial pig production units in 2012 revealed a slight decrease in sow numbers when compared to the previous survey. Irish sow numbers are shown in Table 9.
(Source: Teagasc Pig Development Department)
As this survey was completed in January 2012, it does not reflect the full difficult trading conditions suffered during 2012. Anecdotal evidence would suggest that there has been a slight decrease in the national sow herd during 2012 due to some herds undertaking destock-restock activity and a number of herds downsizing in advance of loose sow housing legislation. This assertion appears to be supported by the increased number of sows being culled in Irish export plants in 2012, as illustrated in Table 10.

(Source: DAFM)
The number of pig disposals in 2012 was estimated two percent higher than in 2011. This reflected an increase in the productivity of the national sow herd and the introduction of new vaccines onto the market which reduced mortality.

(Source: Teagasc Pig Development Department)
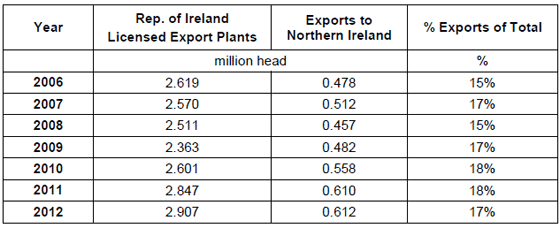
The ratio of Republic of Ireland origin pigs in total pig slaughter in Northern Ireland plants had been increasing in recent years but fell slightly in 2012 to 17 per cent as illustrated in Table 12.
(Source: DAFM & DARDNI)
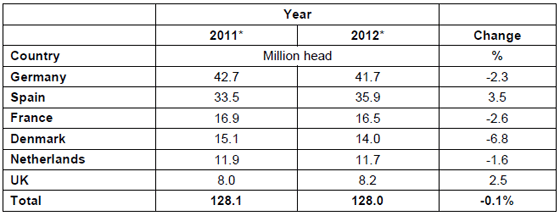
The trend of increased Irish slaughter pig disposals in 2012 was opposite to the trend in many of the European countries, as illustrated in Table 13. Over the first 44 weeks of 2012 the combined pig slaughtering of the major European producing countries remained relatively static when compared to 2011.
(Note: *Based on 44 wks of production; Source: MPB)
As illustrated in Figure 5, a further analysis of the principal exporting countries (Germany, Netherlands, Denmark), reveals a year-on-year decline of 3.2 per cent (2011-2012) and reverses the recent upward trend of numbers slaughtered.
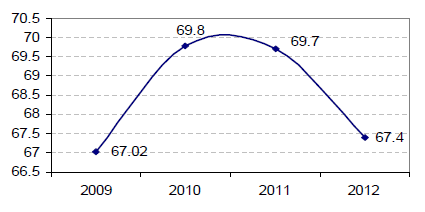
(Source: MPB)
EU Pigmeat Exports and Imports in 2012
The export of pigmeat products outside the EU continued to marginally increase in 2012 as shown in Table 14. However this followed a very strong export year in 2011. The largest export destinations were Russia, Hong Kong, China and Japan which contributed 62 per cent of the total volume exported from the EU. Globally all the largest pigmeat export countries showed a combined growth of 2.8 per cent.

(Source: MDP * Jan-Sept 12)
Outlook for the Irish Pig Market in 2013
The outlook for the pig market can be decomposed into pig feed and pig price as these will be the key factors affecting profitability.
Irish pig feed price outlook in 2013
Pig feed is the single largest input cost (currently 75 percent) of pig production therefore the cost trend of this input will have a substantial effect on the profitability of the sector in 2013. The feed outlook can divided into the outlook for wheat and soyabeans as these are the principal pig feed cost drivers.
Wheat prices in 2013
The poor Black Sea harvest in 2012 has resulted in wheat exports being reduced to a
very low volume by December 2012. As we progress into 2013, this will cause greater
upward pressure on wheat prices as the remaining major exporters (US, France,
Argentina, Australia) will be under greater demand.
The closing stock in Table 15
illustrates the recent poor 2012/13 harvest and the estimated tightening closing
stock-to-use ratio by June 2013. However, the expectation of a good harvest in 2013
will be clearly evident by June 2013 (start of harvest season). Presuming that this
harvest see’s a return to global five year average yield returns for wheat and maize
then this should stimulate the beginning of a gradual wheat price easing from July to December 2013.

(Source: USDA & Strategie Grains)
Soybean
Soyabean production was severely affected in 2012, initially by the South American drought and then by the US drought. The result of this was a global fall in production from 264 to 240 million tonnes. The outcome of this production decrease was the highest soyabean price in recent times. The Brazilian and Argentinian planting intentions reveal significantly higher soyabean forecasts for the 2013 harvest, with Brazil estimated to increase its production by 20 million tonnes. If the US can return a five-year production average then the soyabean closing stock will rise in 2013. This will lead to downward pressure from May 2013 for the duration of the year.
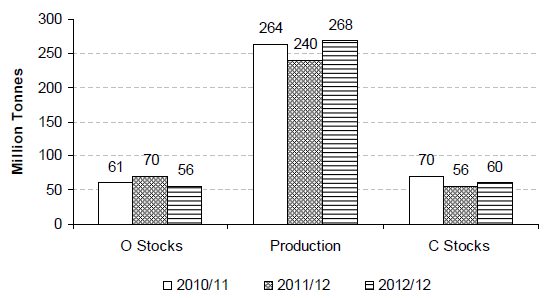
(Source: USDA)
When examining the soyabean market it is important to examine the importation intentions of the Chinese market. The estimated Chinese import total for 2013 is 63 million tonnes. This is approximately 64 per cent of the global export market and an increase since 2011 of 17 per cent as illustrated in Table 16.

(Source: USDA)
Irish pig feed prices in 2013
The estimated composite compound feed price in December 2012 was €372 per tonne. The restricted global supply pressure of wheat and maize during the January–June period will generate upward price pressure with a corresponding fall upon the arrival of the Northern Hemisphere harvest. The current feed ingredients future market indicates an annual increase of six per cent over the 2012 composite price. This price increase will be dependent on the Euro exchange rate remaining relatively steady and the volume of Chinese soyabean purchases being close to the predicted volume of 58 million tonnes for 2012-13.
Irish Pig Prices in 2013
The Irish pig price was relatively strong in 2012 and in the author's view, this will
continue in 2013. The continuing reduction in the EU sow herd size and the trend of
declining slaughter pig disposals will reduce the availability of pigs for sale. In
addition the buoyant export market looks set to continue with the exports to China in
particular expected to increase further.
An analysis of the global pig price futures
indicates an average increase of 6.2 per,cent with the US Chicago futures market
currently (December 2012) showing an increase of 11 percent in 2013.
Profit Margin
If the composite feed price falls as forecast in the latter half of 2013 and the pig price remains buoyant, there will be an overall moderate improvement in the profit margin available for pig producers in 2013. This margin is critically required in order to restore the industry to a sound financial base, allow feed debt to be reduced, enable producers to undertake much needed repairs and to investigate the feasibility of further investment in building infrastructure.
Conclusions
In 2012, the Irish pig industry suffered the highest feed prices in over 20 years,
primarily due to the escalating feed ingredient costs. In light of these conditions, the
size of the Irish sow herd has remained very resilient with only a small reduction in
size. The outlook for 2013 is for the industry to continue to remain tight for the first
two quarters with an improvement in margins expected in the latter half of the year.
The composite pig feed cost of €372 in December 2012 is expected to further
increase primarily due to the tightening international supply of wheat and maize
before reducing with the approach of the autumnal harvest in the Northern
Hemisphere. Overall the composite feed price in 2013 is expected to be six per cent higher
then in 2012.
The pig price was strong in 2012, the highest since the introduction of the Euro but
not sufficiently high to offset the negative impact of the rapid rise in feed costs on
profitability. It is expected that the market conditions in 2012 will continue to return a
high pig price primarily due to a reducing number of pig disposals in the main
European pig producing countries and strong export conditions outside the EU. The
principal EU export markets are expected to increase their pigmeat imports during
2013 by 6.1 per cent. The outlook on the global pig futures markets currently indicate
an increase of 6.2 per cent in 2013 but the actual price may be moderately higher if
the 6.1 per cent export target is reached.
The higher feed cost in the first two quarters of 2013 and increasing pig price are
expected to generate continued tight margins for the first two quarters. A reduction in
feed prices and the maintenance of the high pig price in the latter half of the year will
provide an increased margin. This increased margin is urgently needed for the
industry to reduce previous accumulated losses and allow necessary repair and
infrastructure investment.
January 2013


