

Minimum Inhibitory Concentration and Minimum Bactericidal Concentration Results for Brachyspira Species: What is the Difference?
Selected antibiotics commonly used in pigs have bactericidal properties approximately double the MIC value, according to research by David Burch and others in the UK presented at The European Symposium on Porcine Health Management (ESPHM) 2014. They also establish the antimicrobial resistance - defined by different measures - of Brachyspira hyodysenteriae, the pathogen causing swine dysentery.Introduction
Terms used to describe the antimicrobial resistance break-point value for Brachyspira species can be confusing and ill-defined, according to first-named author, David Burch of Octagon Services Ltd, UK, with co-authors from SAC Consulting. Is it the epidemiological cut-off value (ECOFF), an inhibitory break-point (IBP) or a clinical (therapeutic) break-point (CBP)?
Minimum inhibitory concentration (MIC) can indicate the lowest concentration at which clear inhibition of bacterial growth has occurred or the lowest concentration at which no bacterial growth occurs. The latter circumstance describes the minimum bactericidal concentration (MBC).
Attributing the correct term and cut-off/break-point in the test is particularly important for assessing the efficacy of agents that work by inhibiting the target organism.
Comparative MIC and MBC results for Brachyspira hyodysenteriae are presented and compared with antimicrobial concentrations achieved in the colon contents, to estimate inhibitory breakpoints.
Methods
The MIC and MBC were determined using the agar dilution method with the specified antibiotic incorporated in serial two-fold dilutions from 0.031μg to 128μg per ml.
The B. hyodysenteriae isolates were cultured from clinical samples submitted to SAC Veterinary Services, Edinburgh between the years 2004-2013.
Samples were from pigs with a history of diarrhoea, mostly from herds in the UK.
The ECOFF was determined by the MIC susceptibility pattern, the IBP by the maximum drug concentration in the colon contents (MCCC) and the CBP by dividing the MCCC by four, approximately equivalent to the area under the curve (AUC) 24h divided by the MBC=100h5.
Results
The results of the MIC and MBC determinations are summarised in Table 1. Published data for antibiotic colon contents concentrations (CCCs) are in Table 2.
| Table 1. Summary of MIC and MBC results (µg/ml) | ||||
| Antibiotic | No. of isolates | MIC 50 | MIC 90 | MIC range |
|---|---|---|---|---|
| Tiamulin | 88 | 0.125 | 4.0 | <0.031-32 |
| Lincomycin | 66 | 16 | 64 | <0.031->128 |
| Tylvalosin | 45 | 8.0 | 32 | 0.5-64 |
| Valnemulin | 47 | 0.031 | 1.0 | <0.031-16 |
| Tylosin | 18 | >128 | >128 | >128 |
| Antibiotic | No. of isolates | MIC 50 | MIC 90 | MIC range |
| Tiamulin | 86 | 0.25 | 4.0 | <0.031-32 |
| Lincomycin | 66 | 32 | 128 | <0.031->128 |
| Tylvalosin | 45 | 16 | 32 | 0.5->128 |
| Valnemulin | 47 | <0.031 | 2.0 | <0.031-16 |
| Tylosin | 18 | >128 | >128 | >128 |
| Table 2. Published data for colon contents concentration (CCC) for various antibiotics (E = estimated value) |
|||||
| Antibiotic | In feed conc (ppm) | CCC (µg/g) | Antibiotic | In feed conc (ppm) | CCC (µg/g) |
|---|---|---|---|---|---|
| Tiamulin | 220(2) | 8.05 | Lincomycin | 220(3) | 101 |
| 110 | 2.84 | 110 | 34.5 | ||
| 40E | 1.03 | 44E | 13.8 | ||
| Valnemulin | 200(1) | 5.6 | |||
| Tylosin | 100E(4) | 38 | 75 | 1.6 | |
| 40E | 15.3 | 25E | 0.53 | ||
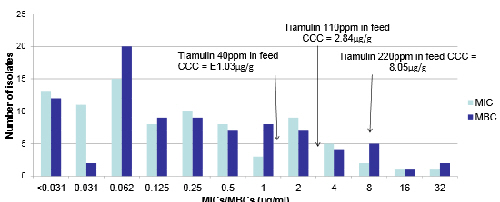
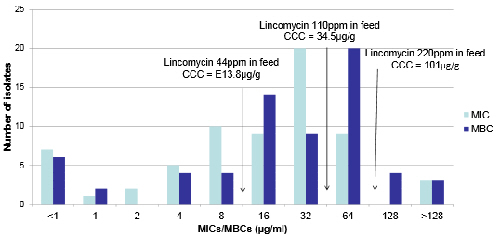
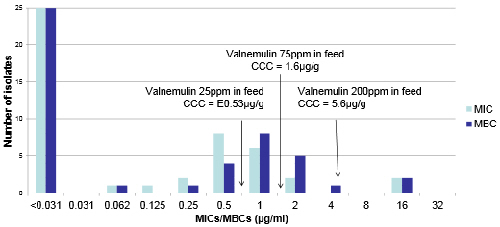
The susceptibility patterns for both MICs and MBCs and CCC relationships for tiamulin, lincomycin and valnemulin are highlighted in Figures 1 to 3 and Table 3.


| Table 3. ECOFFs, IBPs and CBPs for various antibiotics against B. hyodysenteriae | ||||
| Antibiotic | In feed conc. (ppm) | ECOFF (µ/ml) | IBP (µg/ml) | CBP (µg/ml) |
|---|---|---|---|---|
| Tiamulin | 220 | 1.0 | 8.05 | >2.0 |
| Lincomycin | 220 | 2.0 | 101 | >25 |
| Tylosin | 100 | ND (all resistant) | 38 | >9.5 |
| Valnemulin | 220 | 0.062 | 5.6 | >1.4 |
Discussion and Conclusions
Most MIC:MBC 50 ratios are 1: 2, suggesting that these bacteriostatic antibiotics have bactericidal properties approximately double the MIC value.
The establishment and differentiation of ECOFFs, IBPs for prevention and CBPs, where the drug may be used for treatment or even eradication purposes, is helpful not only for gauging the level of resistance in the field but also for the veterinarian making decisions on therapeutic choices.
References
1. Burch, D.G.S. 2005. Pig Journal, 56, 8-24.
2. Anderson, M.D. et al. 1996. Proc. AASP Meeting, 115-118.
3. Degeeter, M.J. et al. 1980. Proc. IPVS Congress, 283.
4. Karanikolova, M. et al. 2010. Proc. IPVS Congress, vol.2, 990.
5. Toutain, P. 2003. J.Vet. Pharmacol. & Therap. (Suppl 1) 1-8.
Reference
Burch D., J. Thomson, B. Murray and J. Docherty. 2014. Minimum inhibitory concentration and minimum bactericidal concentration results for Brachyspira species – What is the difference? European Symposium on Porcine Health Management. Sorrento, Italy. May 2014.
June 2014


