

Effects of Fibre on Optimal Threonine:Lysine Ratio for 25 to 50kg Growing Gilts
Research at the Hans H Stein Monogastric Nutrition Lab at the University of Illinois reveals a higher threonine requirement for pigs fed a high-fibre diet than for a low-fibre diet, based on optimised growth rate.Use of high-fibre, low-cost ingredients, such as co-products from grain processing industries, in swine diets is increasing.
Pigs fed diets containing high levels of fibre have increased intestinal mass due to increased amount of microbial fermentation in the hindgut. Therefore, they also have increased endogenous loss of amino acids in the form of mucins, the proteins that line the intestinal tract. The abrasiveness of fibre stimulates the secretion of mucins as well.
These factors may cause the threonine requirement to be increased in high-fibre diets because threonine is present in large amounts in mucins. Therefore, an experiment was conducted to determine the effects of dietary fibre on the optimum threonine:lysine ratio (Thr:Lys) in 25 to 50kg growing gilts.
Materials and Methods
A total of 192 gilts with average initial body weight of 26.29kg were fed one of 12 diets.
The low-fibre basal diet contained approximately 0.40 per cent SID Thr and 0.90 per cent SID Lys. The high-fibre basal diet was formulated by adding 15 per cent soybean hulls to the low-fibre basal diet at the expense of corn starch. Ten additional diets were formulated by adding crystalline L-Thr to each basal diet to create diets containing SID Thr:Lys ratios of 0.45, 0.54, 0.63, 0.72, 0.81, and 0.90. Pigs were weighed at the beginning of the study and on the 28th day, and final bodyweight, average daily gain (ADG), average daily feed intake (ADFI) and gain:feed ratio (G:F) were calculated.
Broken-line and quadratic analysis were used for each of the growth performance measures. In broken-line analysis, determinations for requirements are defined as the intersection point between the slope and plateau portion of the model.
Quadratic analysis fits a quadratic line to the data, and estimates the requirement as the level determined by the apex of the curve.
Broken line analysis tends to yield conservative estimates, while quadratic analysis may overestimate requirements.
Therefore, a combination of the two types of analyses was used. The concentration of Thr at which the quadratic regression line and the plateau value from the broken line analysis intersected was used to estimate the ideal SID Thr:Lys ratio for those growth performance parameters which differed both linearly and quadratically.
The estimated ideals within each fibre level were averaged, and the average was determined to be the ideal SID Thr:Lys ratio.
Growth Performance
For pigs fed the low-fibre diets, average daily gain and gain:feed ratio increased both linearly (P<0.01) and quadratically (P < 0.05) as the concentration of Thr increased in the diets (Table 1). Final body weight increased linearly (P<0.01) as Thr concentration increased. Average daily feed intake was not affected by the Thr concentration in the diets.
For pigs fed the high-fibre diets, average daily gain and gain:feed ratio increased both linearly (P<0.001) and quadratically (P<0.05) as the concentration of Thr increased in the diets. Final bodyweight and average daily feed intake increased linearly (P<0.05) as Thr concentration increased.
| Table 1. Growth performance of pigs fed experimental diets | |||||||||
| Thr:Lys | Contrasts (P-value) | ||||||||
|---|---|---|---|---|---|---|---|---|---|
| 0.45 | 0.54 | 0.63 | 0.72 | 0.81 | 0.90 | SEM | Linear | Quadratic | |
| Low-fibre diets | |||||||||
| Initial bodyweight, kg |
26.16 | 26.68 | 26.68 | 25.73 | 26.73 | 26.39 | 0.8 | 0.963 | 0.969 |
| ADG, g | 696 | 769 | 797 | 830 | 836 | 803 | 28.9 | <0.01 | <0.05 |
| ADFI, g | 1,785 | 1,799 | 1,777 | 1,812 | 1,862 | 1,830 | 102 | 0.376 | 0.917 |
| G:F | 382 | 423 | 450 | 455 | 445 | 435 | 20.9 | 0.001 | <0.001 |
| Final bodyweight, kg |
45.66 | 49.43 | 49.56 | 49.5 | 50.13 | 50.36 | 1.15 | <0.01 | 0.132 |
| High-fibre diets | |||||||||
| Initial bodyweight, kg | 26.47 | 26.85 | 26.72 | 26.57 | 26.28 | 26.72 | 1.31 | 0.924 | 0.964 |
| ADG, g | 763 | 882 | 878 | 900 | 933 | 915 | 35.48 | <0.001 | <0.05 |
| ADFI, g | 1,828 | 1,872 | 1,835 | 1,864 | 1,945 | 1,989 | 64.9 | <0.05 | 0.409 |
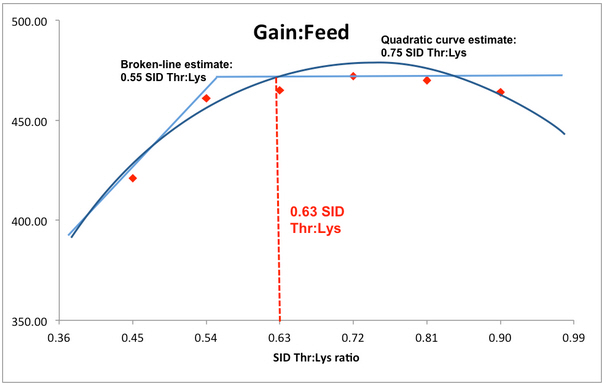
| G:F | 421 | 461 | 465 | 472 | 470 | 464 | 21.91 | <0.01 | <0.01 |
| Final bodyweight, kg |
48.14 | 51.86 | 51.67 | 52.08 | 52.7 | 52.64 | 1.61 | <0.05 | 0.145 |
Thr:Lys Requirement Estimates
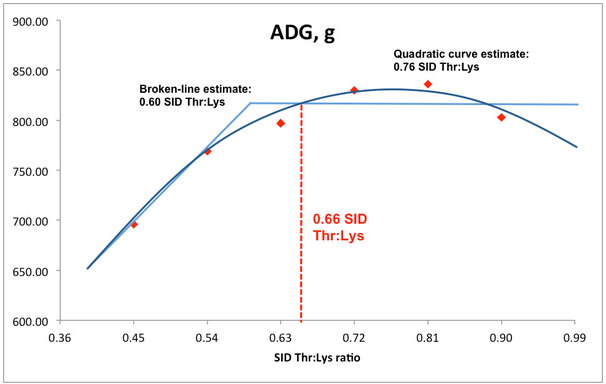
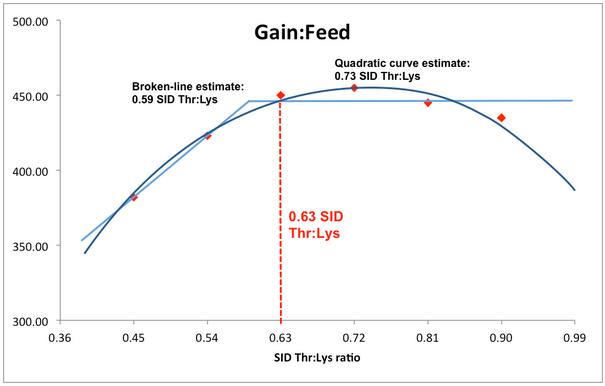
For pigs fed the low-fibre diets, broken-line analyses estimated the optimum SID Thr:Lys ratio to be 0.60 for average daily gain (Figure 1) and 0.59 for gain:feed ratio (Figure 2).
Quadratic analyses estimated the optimum SID Thr:Lys ratio to be 0.76 for average daily gain (Figure 1) and 0.73 for gain:feed ratio (Figure 2).
Combining the broken-line and quadratic analyses yielded an estimated optimum SID Thr:Lys ratio of 0.66 for average daily gain (Figure 1) and 0.63 for gain:feed ratio (Figure 2).
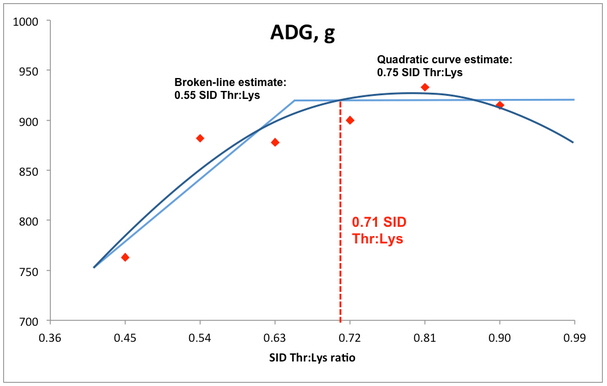
For pigs fed the high-fibre diets, broken-line analyses estimated the optimum SID Thr:Lys ratio to be 0.66 for average daily gain (Figure 3) and 0.55 for gain:feed ratio (Figure 4).
Quadratic analyses estimated the optimum SID Thr:Lys ratio to be 0.80 for average daily gain (Figure 3) and 0.75 for gain:feed ratio (Figure 4).
Combining the broken-line and quadratic analyses yielded an estimated optimum SID Thr:Lys ratio of 0.71 for average daily gain (Figure 3) and 0.63 for gain:feed ratio (Figure 4).
Key Points
For 25 to 50kg growing gilts fed high-fibre diets, average daily gain will be optimised with a Thr:Lys ratio is 0.71.
For 25 to 50kg growing gilts fed low-fibre diets, the ideal Thr:Lys ratio to optimise average daily gain is 0.66.
The ideal Thr:Lys ratio to optimise gain:feed ratio in 25 to 50kg growing gilts is 0.63, regardless of fibre content of the diets.
February 2015


