


Contemporary Market Weights
Ronald O. Bates of Michigan State University and Thomas Guthrie of Michigan State University Extension demonstrate that marketing decisions should be based on lean growth potential, marginal feed efficiency through heavier weights, the packer grid in which market pigs are priced and space availability within the production system.Introduction
Over the last year the pork industry has experienced and is recovering from an outbreak of a novel disease Porcine Epidemic Diarrhoea virus (PEDv). For many farms that experienced PEDv, weeks of production were lost or drastically reduced. This severely cut supply which caused price to rapidly increase.
During summer 2014, the industry witnessed record prices received for market pigs. With extra finishing space due to a reduction in pigs produced, a relatively mild summer which caused growth rate to be better than normally experienced during summer, and high market price, market weights increased to a greater degree than many would have foreseen.
As average market weights reached and sometimes surpassed 285 lb, many have questioned if average market weights will continue to push higher or drop back to recent historical averages (Figure 1).
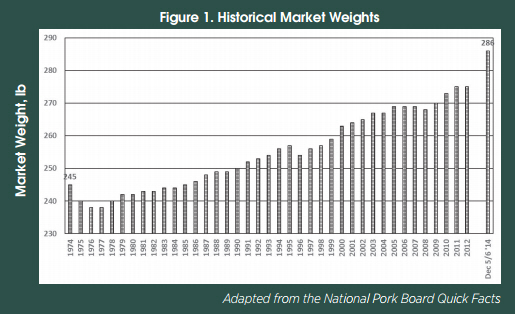
Over the last two decades, lean growth and feed efficiency have dramatically improved at heavier market weights, which has resulted in pigs remaining profitable at heavier market weights. Most contemporary terminal cross pigs are profitable at heavier weights and with continued selection for improved lean gain and feed efficiency, pigs continue to be relatively lean at heavier and heavier weights.
This article evaluates a few scenarios regarding the marginal profitability of heavy market weight pigs.
Evaluation Methods
Optimum market weights were calculated for three different scenarios with differing ration costs for the final ration to be fed to finishing pigs. An existing Excel™ spreadsheet tool from Dr John Lawrence, Iowa State University was used and is available to pork producers on the internet (www.ipic.iastate.edu/software). In addition, the marketing information for an existing packer marketing matrix was used. The buying program used was considered to be more favorable for heavy weight pigs. Lean percentage premiums and discounts along with possible sort loss were included in the calculations to determine results applicable to contemporary pork production.
Assumptions
To complete these calculations, commercial prices were solicited for the last ration to be fed before marketing with an estimated ration cost of $225/ton. A similar evaluation regarding market weight was conducted in December 2010 (Bates et al., 2011). As a reference, the cost of the last ration that was used in that exercise for 2010 ($215 per ton), was included (Figure 2).
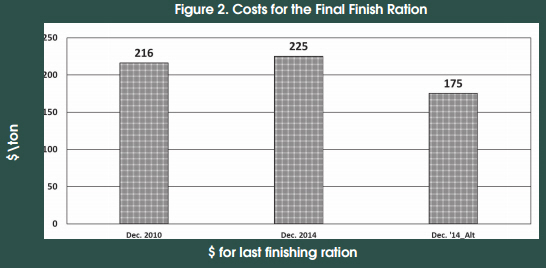
In addition, an alternative priced ration for December 2014 was also included ($175 per ton). The cost of the alternative ration was based on known differences occurring for ration costs across Michigan pork producer farms. Pig performance used in this evaluation is listed in Table 1.

Pigs were assumed to grow 1.88 lb per day, regardless of the final weight in which they were marketed. Pigs were not considered for marketing until they reached 258 lb. Furthermore, it was assumed that the decision to market pigs would occur in weekly increments. That is, if pigs were not marketed at a given weight, they would be held for an additional seven days. In addition it was assumed that space was not limiting, such that pigs could be marketed at any weight chosen without space concerns for the rest of the production schedule. Furthermore, it was also assumed that there would be a slight increase (0.3 per cent) in the percentage of dead or downer pigs observed if pigs were marketed at heavier weights.
Marginal feed efficiency as pigs increased in weight was also estimated. Typically feed efficiency is measured from pig placement, either as a weaned pig or feeder pig, until reaching market weight. However, to determine optimal market weight it is critical to know what feed efficiency is from two different ages or weights that occur later in the growth phase (Figure 3).
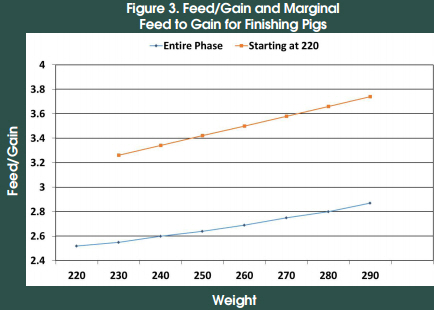
Feed efficiency is illustrated in two ways.
The first is that feed efficiency is calculated for the entire growth phase to different end weights starting at 220 lb. For instance, with an end weight of 220 lb feed efficiency, measured as pounds of feed per pound of gain, is approximately 2.5 for the entire growth phase. For an end weight of 290 lb, feed efficiency is 2.9 for the entire growth phase. The second way that feed efficiency is represented as marginal feed efficiency. That is the feed efficiency between two different weights, regardless of the feed efficiency up to the initial weight. For instance the marginal feed efficiency from 220 to 230 lb is approximately 3.3 lb feed per pound of gain while from 280 to 290 lb; the marginal feed efficiency is approximately 3.7. Marginal feed efficiency was developed for each of the beginning and ending weights evaluated adapting results from previous research completed at Michigan State University (Edwards et al., 2006) and current industry averages.
Lean percentage also changed as pigs increased in weight. For example, the initial market weight evaluated was 258 lb with an estimated lean percentage of 56 per cent. When pigs were held for an additional week, their subsequent end weight was 271 lb (Table 2).
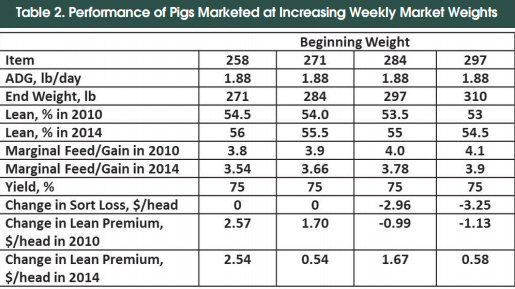
Feed efficiency for the additional week, measured as feed/gain, was 3.54 and at marketing their percentage lean was 56 per cent. Utilising a respective packer grid, no sort loss was in effect for 271-lb pigs. Moreover, each carcass achieved an additional $2.54 per head in lean premium.
Table 2 illustrates the information used for the evaluation completed in 2010. This was included to demonstrate that there has been favorable change over time for percent lean and feed efficiency.
Market Weight and Feed Price
The results of the three different feed price scenarios are shown in Figure 4.
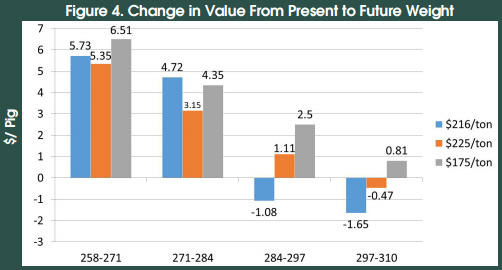
The results are reported as the value change per head for pigs kept to the heavier weight. For example, for December 2010 ($216 per ton), if pigs were marketed at 271 lbs. they would be worth $5.73 more than if they were marketed at 258 lbs. For December 2014, the pigs would be worth $5.35 more per head at 271 lbs. than at 258 lb. For the scenario using the alternative priced ration for 2014 ($175 per ton), pigs sold at 271 lbs. would worth $6.51 per head more than if they were sold at 258 lbs. The interpretation holds true for each category. In this analysis, as long as the net variable return remains above $0.00, then with all things being equal it is more profitable to sell pigs at the heavier weight.
In this analysis, using the December 2010 assumptions, it was evident that pigs should be sold as they neared 284 lbs. However, using the 2014 assumptions pigs could be sold heavier and remain profitable. For the ration priced at $225 per ton, pigs remained profitable until they neared 297 lbs. For the lower priced ration at $175 per ton, pigs remained profitable at sale weights through 310 lbs. This implies that for the most part, even with relatively high priced feed and lower market price ($65 per cwt, live weight), it remains profitable to sell pigs at or above 300 lbs.
Optimum Weight Using Partitioning Agents
To further improve lean gain and feed efficiency, some producers use feed additives, such as Paylean™, marketed by Elanco. Paylean has been reported to improve growth, feed efficiency, lean percentage and yield. To effectively use Paylean, the ration, compared to typical finisher rations, must contain higher levels of amino acids to support the increased lean gain, which may add additional cost to the ration. To evaluate how a feed additive such as Paylean impacts the marginal profitability of selling pigs at heavier weights, a scenario was developed using both December 2014 feed costs for the final ration.
Table 3 shows the information used to complete this evaluation. Feed cost for the two final finishing rations were increased by $25 per ton to account for the inclusion of Paylean and increased levels of amino acids.
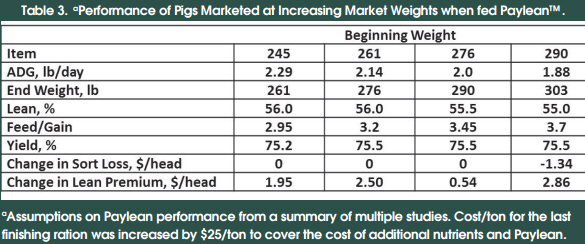
This evaluation was conducted differently than those previously discussed. Initial weight was 245 lbs. instead of 258 lbs., accounting for pig weight when Paylean was first included in the feed. In addition, average daily gain, feed efficiency, percent lean and dressing percentage were adjusted to resemble what would be expected to occur when feeding Paylean over the four-week scenario that was evaluated.
Figure 5 illustrates potential returns of this hypothesised Paylean scenario.
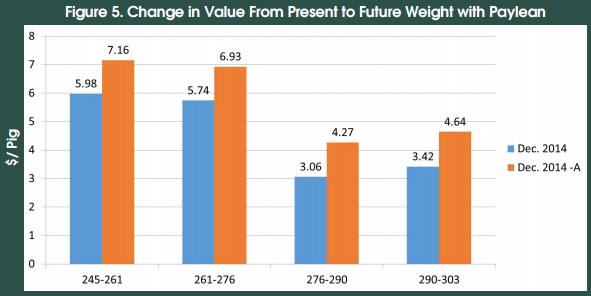
When feeding the December 2014 ration at $250 per ton ($225 +$25), pigs at 261 lbs. were worth a net $6 more head than at 245 lbs. The same was true for the rest of the increasing weight scenarios. Pigs marketed at 276 bs. were worth $5.74 more per pig than pigs at 261 lbs. Pigs weighing 290 lbs. were worth $3.06 more per head than pigs weighing 276 lbs. and pigs weighing 303 lbs. were worth $3.42 more per head than pigs weighing 290 lbs.
When considering the alternative December 2014 feed price of $200 per ton ($175+25), the results showed that pigs at each increasing weight were worth more than the previous weight considered. This implies that when considering a conservative feed price and pig performance, pigs marketed at heavier weights remain profitable for pork producers.
Conclusion
Determining optimum market weight will differ from farm to farm.
Marketing decisions should be based on lean growth potential, marginal feed efficiency through heavier weights, the packer grid in which market pigs are priced and space availability within the production system.
With continued improvement in lean gain and feed efficiency to heavier market weights, market weights will remain at or above current annual industry averages, unless there are extreme increases in feed prices or extreme declines in market price.
Producers should carefully evaluate optimum market weights to improve profit potential and reduce risk.
Literature Cited
- Bates, R.O., T. Guthrie and D. Rozeboom. 2011. High input costs and market weights. Pork Quarterly. Vol.16(2):1-8. IN MI Pork. Vol.36(2).
- Edwards, D.B., R.J. Tempelman and R.O. Bates. 2006. Evaluation of Duroc- vs Pietrain-sired pigs for growth and composition. J. Anim. Sci. 84:266-275.
The authors state that reference to commercial products does not imply endorsement by them or Michigan State University.
May 2015


