

Effects of Water Availability and Space Allowance on Productivity and Profitability
Increasing the number of pigs per pen and consequently reducing available floor space reduced daily gain and feed intake in grower-finisher pigs in this experiment in the Prairie Swine Centre Annual Report 2013-14 reported by J. Landero, A.D. Beaulieu and M. Young.Summary

Reduced floor space allowance for pigs may negatively affect growth performance as a result of competition for feed and water access, especially at later stages of the grower-finisher period. However, kilograms of pork produced per unit of floor space may increase with more pigs per pen, improving overall profitability for pork producers.
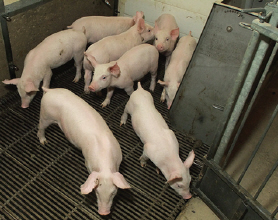
The effect of space allowance was tested by altering the numbers of pigs per pen to provide 8.2, 7.4 or 6.8 square feet space allowance per pig. The effect of water availability was tested by adding one extra bowl drinker to create non-restricted water availability, or leaving as is to create restricted water availability.
In total, 1,008 pigs (initial bodyweight 32.1kg) were used to evaluate the effects on profitability, carcass traits and growth performance during the grower-finisher period.
Despite an overall growth performance reduction observed with increased pigs per pen, results from this trial clearly indicate that producer’s profitability per square foot is increased.
The findings of this trial also indicated that access to an extra water source in high stocking densities will improve profitability of the swine unit.

Introduction
Space allowance, or stocking density, is expressed in terms of pigs per floor area. Space allowance requirements are based on the bodyweight of the pig, which is proportional to surface area of the pig.
The optimal space allowance is the minimum area per pig for maximal individual weight gain. Many experiments have arrived at the same conclusion: “a decrease in space allowance per pig reduces growth performance” because reduced floor-space allowance increases competition for water and feed, reducing feed intake and consequently bodyweight gain.
However, from an economic perspective, it is clear that fewer pigs per pen means less kilograms of pork will be produced per pen, despite the improvement in individual weight gain.
Under conventional management in the grower-finisher period, pigs remain in the same pen for several weeks until they reach market weight. The maximum space requirement has to be calculated based on the day that the first pig is sent to market. Considering a target market weight of 125kg, the first pigs would be typically sent to market when the average weight of pigs in the pen is around 105 to 110kg.
According to the Canadian Code of Practice for the Care and Handling of Pigs (2014), the minimum space allowance per pig under these circumstances will be 0.75 to 0.77 square metres or 8.04 to 8.29 square feet. According to the same publication, a decrease of up to 15 per cent is allowed in the grower-finisher period if the higher stocking density does not compromise the welfare of animals.
The following experiment was designed to evaluate the effects of increasing water availability and stocking density on profitability, carcass traits and growth performance during the grower-finisher period.
Experimental Procedure
The trial was conducted at the grow-finish Drumloche Research Barn (Lougheed, AB, Canada) using 1,008 pigs. Space allowance and water availability provided six treatments, with eight pens per treatment.
Pens had 19, 21 or 23 pigs, and altering the number of pigs per pen gave a floor space allowance of 8.2, 7.4 and 6.8 square feet (0.76, 0.69 and 0.63 square metres) space allowance per pig, respectively. Pigs were either water restricted, or non-restricted by the addition of one extra bowl drinker. Each pen had two feeder spaces at a wet/dry feeder, and was fed a four-phase diet based on average pen weight from start of the trial to market weight.
Pigs were weighed every feed phase change to calculate average daily gain for each feed phase and for the overall period. The amount of feed delivered by the feed system, FeedLogic, was recorded daily, and the feed remaining at the end of each phase was measured to calculate average daily feed intake. Weight gain and feed usage was used to calculate feed conversion (feed:gain) per phase of feeding and for the overall period.
Pigs reaching market weight (123kg) were slaughtered and carcass characteristic data collected (carcass weight, dressing percentage, backfat, loin depth, and index).
Results and Discussion
Performance results are shown in Table 1. A decrease in space allowance reduced overall average daily gain (ADG), and tended to reduce overall average daily feed intake (ADFI) but did not affect overall feed:gain ratio (F:G), which agrees with previous studies.
| Table 1. Effect of group size of pigs (stocking density) and water availability on growth performance of grower-finisher pigs1 |
||||||||||
| Water availability2 | Restricted | Non-restricted | P-value | |||||||
|---|---|---|---|---|---|---|---|---|---|---|
| Density (no. of pigs/pen) | 19 | 21 | 23 | 19 | 21 | 23 | SEM | Density | Water | Density × water |
| Grower 1 (32-56kg) | ||||||||||
| ADG, g/day | 1,011 | 1,017 | 1,025 | 1,020 | 1,002 | 1,021 | 11 | 0.234 | 0.593 | 0.343 |
| ADFI, kg/day | 2.26 | 2.24 | 2.23 | 2.27 | 2.24 | 2.21 | 0.04 | 0.088 | 0.849 | 0.772 |
| Feed:gain | 2.24 | 2.21 | 2.18 | 2.23 | 2.23 | 2.16 | 0.03 | 0.010 | 0.838 | 0.562 |
| Grower 2 (56-76kg) | ||||||||||
| ADG, g/day | 1,042 | 1,021 | 997 | 1,046 | 1,037 | 998 | 19 | <0.001 | 0.427 | 0.774 |
| ADFI, kg/day | 2.69 | 2.71 | 2.62 | 2.67 | 2.65 | 2.65 | 0.07 | 0.206 | 0.392 | 0.361 |
| Feed:gain | 2.58 | 2.66 | 2.63 | 2.55 | 2.56 | 2.65 | 0.04 | 0.022 | 0.083 | 0.059 |
| Grower 3 (76-99kg) | ||||||||||
| ADG, g/day | 1,001 | 969 | 903 | 993 | 1,002 | 953 | 20 | 0.002 | 0.127 | 0.311 |
| ADFI, kg/day | 3.09 | 3.05 | 3.02 | 2.98 | 3.01 | 2.90 | 0.08 | 0.084 | 0.005 | 0.588 |
| Feed:gain | 3.09 | 3.15 | 3.39 | 3.01 | 3.00 | 3.06 | 0.11 | 0.057 | 0.005 | 0.240 |
| Finisher (99-122kg) | ||||||||||
| ADG, g/day | 832 | 808 | 824 | 829 | 852 | 849 | 16 | 0.896 | 0.089 | 0.338 |
| ADFI, kg/day | 3.15 | 3.13 | 3.13 | 3.02 | 3.19 | 3.03 | 0.07 | 0.189 | 0.124 | 0.105 |
| Feed:gain | 3.79 | 3.89 | 3.81 | 3.65 | 3.74 | 3.57 | 0.10 | 0.132 | <0.001 | 0.675 |
| Overall (32-122kg) | ||||||||||
| ADG, g/day | 962 | 942 | 926 | 961 | 963 | 947 | 8 | 0.004 | 0.021 | 0.218 |
| ADFI, kg/day | 2.83 | 2.82 | 2.79 | 2.76 | 2.81 | 2.72 | 0.06 | 0.056 | 0.025 | 0.384 |
| Feed:gain | 2.94 | 2.99 | 3.01 | 2.88 | 2.91 | 2.87 | 0.05 | 0.260 | <0.001 | 0.365 |
| 1 Least square means based on 8 pen-observations per diet. 2 Pigs non-restricted and restricted did have access or not to 1 extra drinker in the pen |
||||||||||
As expected, the reduction in growth performance attributed to the reduced space allowance was more evident with the increased weight and size of the pigs. For example, average daily gain was not affected during Grower 1 (32-56kg) feeding phase, but stocking density started to reduce average daily gain by approximately 50g per day during the Grower 2 (56-76kg) feeding phase.
This pattern continued through to the pre-marketing finisher period but as soon as the first pigs were removed average daily gain was improved.
Water availability did not affect average daily gain during Grower 1 to 3 but tended to increase average daily gain during the Finisher feeding phase when an extra drinker was available for pigs. Provision of an additional drinker did reduce dry matter intake in pigs, and thus improved feed:gain ratio during the Grower 3 and Finisher phases (Table 1).
Carcass characteristics were not affected by either stocking density or water availability.
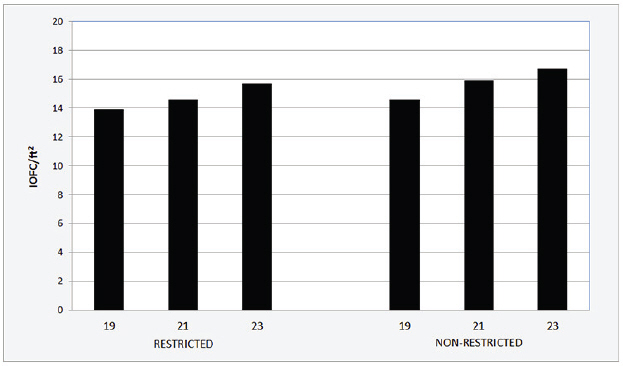
Results from this experiment, however, clearly show that producer’s profitability per square foot increases as both water availability and stocking density increased. The greatest reduction in feed cost per pig due to increased water availability was $2.30, and was found in the 23 pig stocking density with an extra drinker. The increase in number of pigs per pen increased the IOFC (income over feed costs) per square foot by $1.78 for water restricted pigs when numbers went from 19 to 23, and increased $2.08 for non-water-restricted pigs.
The extra drinker increased IOFC by $0.67 for 19 pigs per pen, and by $0.97 for 23 pigs per pen (Figure 1).

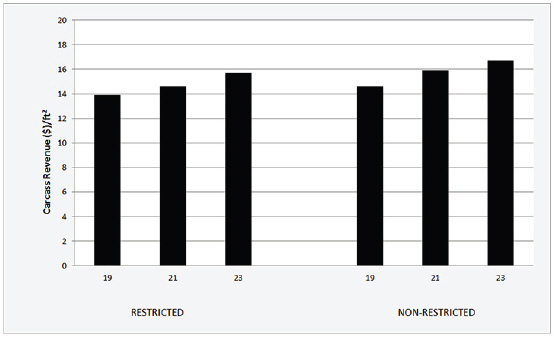
Carcass weight and revenue was also increased by increasing both stocking density and water availability. Total carcass revenue per square foot was increased in $4.61 by increasing pens from 19 to 23 pigs in water restricted pens, and $4.23 for the same pig number increase when water was not restricted (Figure 2).

Conclusion
Increasing the number of pigs per pen and, consequently, reducing available floor space reduced average daily gain and average daily feed intake in grower-finisher pigs.
The addition of one extra drinker resulted in a significant improvement in average daily gain and feed:gain ratio, and reduced average daily feed intake. Despite the overall growth performance reduction with the increased pigs per pen, producer’s profitability per square foot increased.
Producer’s profitability was also improved by providing an additional drinker in the pen.
Acknowledgements: Appreciation is expressed to Drumloche Research Barn management team for their expertise and smooth running of the trial. Thanks also to Lewisville Pork Farm for the use of their animals and Sunhaven Farms Milling for supplying the feed. The authors thank Agriculture and Agri-Food Canada through the Canadian Agricultural Adaptation Program for financial support for this trial.
April 2015


