

Effect of Dietary Changes on Manure Nutrient Content and Value
Iowa State University swine field specialists describe a model that better evaluates pig feeding programmes by including the fertiliser value of the manure.Summary and Implications
The design of the model is to evaluate a more comprehensive valuation of swine feeding programmes other than cost per ton of feed or cost per pound of gain. Ingredient supplies and value may be part of the a production system but if that system depends upon more than pounds of pork out the door, and utilises manure as a fertiliser input for crop production, then how the pigs are fed has consequences other than feed cost per pig or gain.
The model may be used to help identify the role of swine diet formulations in the determination of manure nutrient content and value. This is just one component within a crop to feed to fertiliser cycle, and there are other factors that may influence the nutrient concentrations in swine manure and manure samples need to be taken and analysed prior to field application.
Introduction
The role of swine manure as a nutrient source (fertiliser) for row crops has been increasing in usage and value as commercial fertiliser costs has increased. This practice is an environmentally friendly and synergistic system between pigs and their food source, and thereby has become a motivator for constructing swine facilities, mainly finishing barns.
In many cases, each production entity such as grains, livestock, custom hire, etc are treated as separate profit centres and must stand on their own. In the past, the swine feeding programmes were relatively stable with very little changes. However, as the energy cost of swine diets has increased and feeding programmes have been dramatically changed.
Coffey (1999) wrote about understanding the nutrient cycle on the whole farm approach and identify which production practice generated the most profit from those nutrients. He suggested taking an additional step to evaluate the interrelationship of how each production unit contributes to the other. Simply put, how do grains affect swine diets; diets affect manure; manure composition affect fertiliser application rates, rates affect grain yields, and start the cycle again.
The objective of this paper is to illustrate how similar swine basal nutritional programmes (lysine, metabolisable energy, available phosphorus) requirements for growth should have dramatic difference on the manure nutrient content and thus the projected value of the manure as fertiliser when applied to cropland.
Materials and Methods
A swine feed programme template was modified to incorporate the new Swine NRC (Eleventh Revised Edition, 2012) recommendations for utilisation of nitrogen (N; protein) and phosphorus (P). Total dietary nitrogen and phosphorus were calculated and the difference between feed intake totals and their requirements was considered nutrient excretion. This difference provided a mechanism to evaluate differences in feeding programmes (our scenarios) based on ingredient inclusions, usage of phytase enzyme, and synthetic amino acid(s) to lower phosphorus and crude protein from plant sources, respectively.
Five feeding programmes (10 dietary phases; 12 to 270 lb body weight) that were similar in total lysine and energy levels and available phosphorus, but differed in the usage of (DDGS, phytase enzyme and synthetic amino acids were used for the comparisons of manure nutrient content. Feed programmes are designated by ingredient inclusions. Corn (C), soybean meal (S), synthetic lysine (L; 4lb per ton), phytase enzyme (phy); high amino acid levels (HiAA). So the feeding programme labelled CSL-phy was comprised of corn, soybean meal, 4lb of lysine per ton and a phytase enzyme. The model assumed that pigs would eat and grow at the same rate across all feed programmes.
Results and Discussion
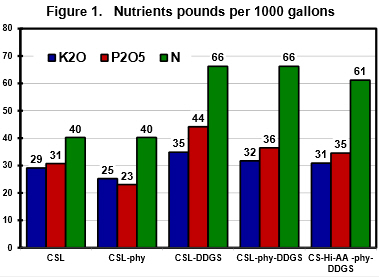
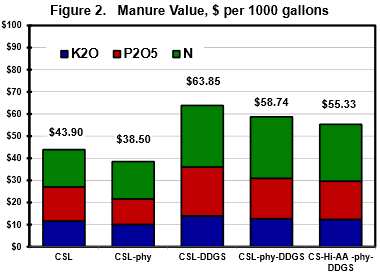
Projected manure nutrient content and value are illustrated in Figures 1 and 2.


Dietary lysine was constant across feeding programmes; however, dietary crude protein levels (nitrogen) varied. Diets including DDGS (max. 600 lb/ton) were higher in nitrogen whereas diets using high levels of synthetic amino acids were ower, thus the amount of nitrogen content in manure reflected these differences (Figure 1).
Phosphate (P2O5) was also higher in the manure from diets containing DDGS even though the feed programmes were balanced on an available phosphorus basis. Including phytase enzyme lowered phosphorus excretion (manure phosphate) as less total phosphorus was required to provide the same available phosphorus across all diets. Potassium is not a nutrient considered in swine diet formulation so it was not considered in the economical comparisons.
Manure value was calculated based on the pounds of nitrogen and phosphate (phosphorus excretion) for the entire feeding period and equated each on a the basis of 1,000 gallons of manure. As the need for phosphate varies across regions and/or fields the nitrogen and phosphate values were evaluated separately. Total feed cost and an adjusted (Adj) feed cost per pigs (as adjusted by nitrogen and phosphate value) were calculated to depict feed cost relative to the manure fertiliser value.
Using the price values in the Sidebar, CSL-phy- DDGS programme had the best projected feed cost per pig of $80.59. The feed costs varied by $1.00 per pig ($80.59 to $81.60) whereas the projected manure nitrogen and phosphate value ranged by $1.30 ($2.02 to $3.32) and a $1.26 ($1.37 to $2.63) respectively (Table 1).
| Table 1. Adjusted feed cost with manure nutrient content value | |||||
| Feeding scenario | CSL | CSL-phy | CSL-DDGS | CSL-phy-DDGS | CS-High-AA- phy-DDGS |
|---|---|---|---|---|---|
| Avg feed cost, $/ton | 234 | 232 | 233 | 231 | 234 |
| Total feed cost, $/pig | 81.56 | 80.89 | 81.31 | 80.59 | 81.60 |
| Manure N value, $/pig | 2.02 | 2.02 | 3.32 | 3.32 | 3.07 |
| Adj. feed $ - N value | 79.54 | 78.87 | 77.99 | 77.28 | 78.53 |
| Manure phosphate value, $/pig | 1.83 | 1.37 | 2.63 | 2.18 | 2.06 |
| Adj feed $ - (N & P2O5 value) | 77.71 | 77.50 | 75.36 | 75.10 | 76.47 |
| Feed ingredient prices: Corn $4.50 /bu; SBM $450/ton; Lysine $0.75/lb; DDGS $220/ton; Mineral premix $720/ton; Mineral premix with phytase $620/ton Calculating manure value: Nitrogen $0.42/lb; P2O5 $0.50 |
|||||
Adjusting pig feed cost by nitrogen and phosphate value lower feed cost by $5.49 ($75.10 per pig) for this feed programme. As feed ingredient prices change, so will the feed cost per pig, as will the value of the nutrient content of the manure with the value of crop fertilisers. This is the important part or use of this model. It allows one to evaluate these price changes and make decisions based more than just the value to the pig, but the contribution to the cropping enterprises.
Assumptions used in the model:
- Pig weight = 12-270 lb
- Feed/pig = 698 lb
- Days on feed = 170
- Corn $4.50 per bushel
- Soybean meal $450 per ton
- DDGS = $220 per ton
- Manure/pig/day= 0.70
- Nitrogen = $0.42 per lb
- Phosphate = $0.50 per lb
- Potassium K20 = $0.40 per lb
The authors of this paper - published in Iowa State University Animal Industry Report 2014 - were Matt Swantek, Dave Stender, Tom Miller and Mark Storlie (swine field specialists).
Further Reading
You can see other papers in the Iowa State University Animal Industry Reports 2014 by clicking here.
June 2014


